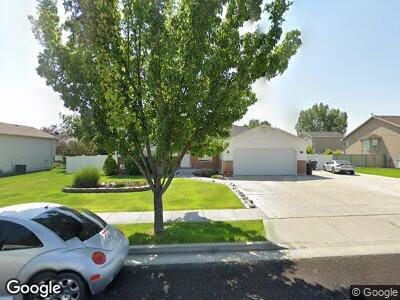
745 W 450 N Tremonton, UT 84337
Estimated Value: $381,000 - $386,572
3
Beds
2
Baths
1,640
Sq Ft
$234/Sq Ft
Est. Value
About This Home
This home is located at 745 W 450 N, Tremonton, UT 84337 and is currently estimated at $384,143, approximately $234 per square foot. 745 W 450 N is a home located in Box Elder County with nearby schools including North Park School, Alice C. Harris Intermediate School, and Bear River Middle School.
Ownership History
Date
Name
Owned For
Owner Type
Purchase Details
Closed on
Aug 12, 2019
Sold by
Hansen Dillan
Bought by
Hansen Dillan and Hansen Abbie
Current Estimated Value
Home Financials for this Owner
Home Financials are based on the most recent Mortgage that was taken out on this home.
Original Mortgage
$184,000
Interest Rate
3.73%
Mortgage Type
New Conventional
Purchase Details
Closed on
May 10, 2018
Sold by
Raedel Colton
Bought by
Merrell David and Merrell Amy
Home Financials for this Owner
Home Financials are based on the most recent Mortgage that was taken out on this home.
Original Mortgage
$201,973
Interest Rate
4.75%
Mortgage Type
FHA
Purchase Details
Closed on
May 13, 2014
Sold by
Graham Travis M and Graham Keera J
Bought by
Raedel Colton
Home Financials for this Owner
Home Financials are based on the most recent Mortgage that was taken out on this home.
Original Mortgage
$155,102
Interest Rate
4.38%
Mortgage Type
New Conventional
Create a Home Valuation Report for This Property
The Home Valuation Report is an in-depth analysis detailing your home's value as well as a comparison with similar homes in the area
Home Values in the Area
Average Home Value in this Area
Purchase History
| Date | Buyer | Sale Price | Title Company |
|---|---|---|---|
| Hansen Dillan | -- | American Secure Ttl Brigham | |
| Hansen Dillan | -- | American Secure Ttl Brigham | |
| Merrell David | -- | American Secure Title Tremon | |
| Raedel Colton | -- | Advanced Title |
Source: Public Records
Mortgage History
| Date | Status | Borrower | Loan Amount |
|---|---|---|---|
| Open | Hansen Dillan | $204,000 | |
| Closed | Hansen Dillan | $184,000 | |
| Previous Owner | Merrell David | $201,973 | |
| Previous Owner | Raedel Colton | $155,102 | |
| Previous Owner | Graham Travis M | $5,427 | |
| Previous Owner | Graham Travis M | $133,292 |
Source: Public Records
Tax History Compared to Growth
Tax History
| Year | Tax Paid | Tax Assessment Tax Assessment Total Assessment is a certain percentage of the fair market value that is determined by local assessors to be the total taxable value of land and additions on the property. | Land | Improvement |
|---|---|---|---|---|
| 2024 | $2,066 | $350,474 | $105,000 | $245,474 |
| 2023 | $2,146 | $357,508 | $100,000 | $257,508 |
| 2022 | $1,927 | $182,949 | $16,500 | $166,449 |
| 2021 | $1,586 | $201,554 | $30,000 | $171,554 |
| 2020 | $1,333 | $201,554 | $30,000 | $171,554 |
| 2019 | $1,239 | $100,000 | $16,500 | $83,500 |
| 2018 | $1,053 | $79,027 | $13,750 | $65,277 |
| 2017 | $1,105 | $143,685 | $13,750 | $118,685 |
| 2016 | $1,087 | $75,918 | $13,750 | $62,168 |
| 2015 | $988 | $70,266 | $13,750 | $56,516 |
| 2014 | $988 | $67,575 | $13,750 | $53,825 |
| 2013 | -- | $67,576 | $13,338 | $54,238 |
Source: Public Records
Map
Nearby Homes
- 745 W 450 N
- 725 W 450 N
- 746 W 400 N
- 769 W 450 N
- 770 W 400 N
- 720 W 400 N
- 416 N 800 W
- 772 W 450 N
- 718 W 450 N
- 685 W 450 N
- 696 W 400 N
- 733 W 500 N
- 967 W 910 N Unit K4
- 947 N 960 W Unit X2
- 929 N 960 W Unit W3
- 921 N 960 W Unit W1
- 921 N 960 W Unit Tremonton UT 84337
- 963 W 910 N
- 929 W 910 N Unit M2
- 963 W 910 N Unit K3