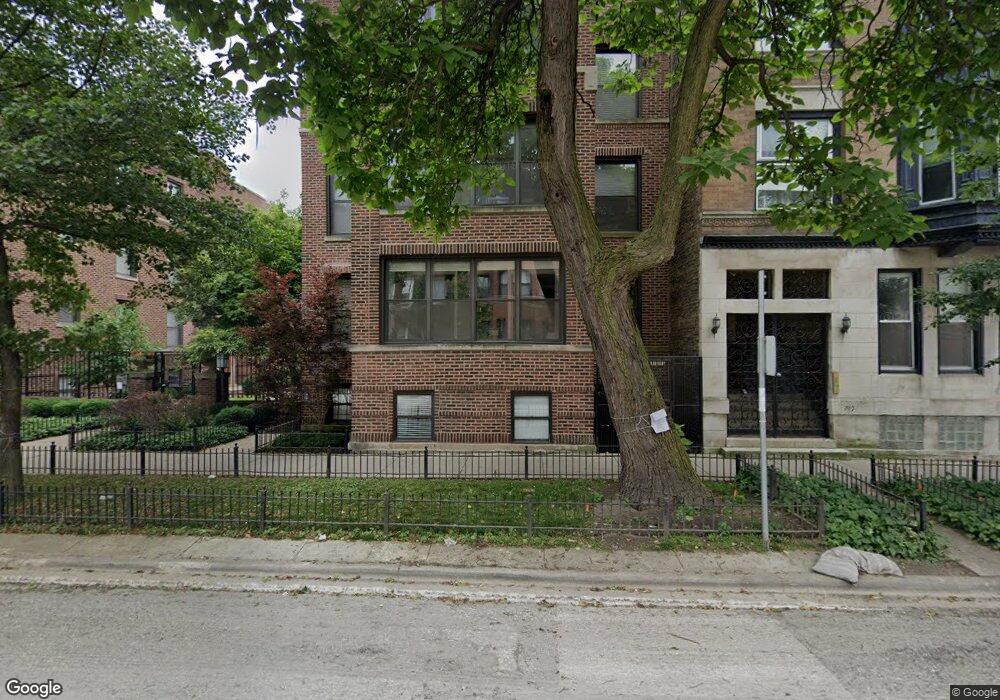
745 W Cornelia Ave Unit S2 Chicago, IL 60657
Lakeview East NeighborhoodEstimated Value: $331,000 - $371,000
2
Beds
1
Bath
--
Sq Ft
0.5
Acres
About This Home
This home is located at 745 W Cornelia Ave Unit S2, Chicago, IL 60657 and is currently estimated at $352,750. 745 W Cornelia Ave Unit S2 is a home located in Cook County with nearby schools including Nettelhorst Elementary School, Lake View High School, and Our Lady Of Mount Carmel Academy.
Ownership History
Date
Name
Owned For
Owner Type
Purchase Details
Closed on
Jun 25, 2021
Sold by
Minton Adam Lane
Bought by
Confino Rafael
Current Estimated Value
Home Financials for this Owner
Home Financials are based on the most recent Mortgage that was taken out on this home.
Original Mortgage
$195,000
Outstanding Balance
$177,175
Interest Rate
2.99%
Mortgage Type
New Conventional
Estimated Equity
$175,575
Purchase Details
Closed on
Dec 14, 2015
Sold by
Hervieux Gilles and Hervieux Mary
Bought by
Minton Adam Lane
Home Financials for this Owner
Home Financials are based on the most recent Mortgage that was taken out on this home.
Original Mortgage
$212,000
Interest Rate
4%
Mortgage Type
New Conventional
Purchase Details
Closed on
Jun 14, 2006
Sold by
First Midwest Bank
Bought by
Hervieux Gilles and Hervieux Mary
Home Financials for this Owner
Home Financials are based on the most recent Mortgage that was taken out on this home.
Original Mortgage
$202,775
Interest Rate
6.73%
Mortgage Type
Fannie Mae Freddie Mac
Create a Home Valuation Report for This Property
The Home Valuation Report is an in-depth analysis detailing your home's value as well as a comparison with similar homes in the area
Home Values in the Area
Average Home Value in this Area
Purchase History
| Date | Buyer | Sale Price | Title Company |
|---|---|---|---|
| Confino Rafael | $295,000 | Proper Title Llc | |
| Minton Adam Lane | $265,000 | Chicago Title Insurance Co | |
| Hervieux Gilles | $277,500 | Multiple |
Source: Public Records
Mortgage History
| Date | Status | Borrower | Loan Amount |
|---|---|---|---|
| Open | Confino Rafael | $195,000 | |
| Previous Owner | Minton Adam Lane | $212,000 | |
| Previous Owner | Hervieux Gilles | $202,775 |
Source: Public Records
Tax History Compared to Growth
Tax History
| Year | Tax Paid | Tax Assessment Tax Assessment Total Assessment is a certain percentage of the fair market value that is determined by local assessors to be the total taxable value of land and additions on the property. | Land | Improvement |
|---|---|---|---|---|
| 2024 | $5,064 | $28,641 | $10,336 | $18,305 |
| 2023 | $4,936 | $24,000 | $8,335 | $15,665 |
| 2022 | $4,936 | $24,000 | $8,335 | $15,665 |
| 2021 | $4,156 | $23,999 | $8,335 | $15,664 |
| 2020 | $4,482 | $23,223 | $3,667 | $19,556 |
| 2019 | $4,413 | $25,392 | $3,667 | $21,725 |
| 2018 | $4,337 | $25,392 | $3,667 | $21,725 |
| 2017 | $3,745 | $20,773 | $3,222 | $17,551 |
| 2016 | $3,660 | $20,773 | $3,222 | $17,551 |
| 2015 | $3,326 | $20,773 | $3,222 | $17,551 |
| 2014 | $3,125 | $19,412 | $2,639 | $16,773 |
| 2013 | $3,052 | $19,412 | $2,639 | $16,773 |
Source: Public Records
Map
Nearby Homes
- 800 W Cornelia Ave Unit 307
- 3430 N Elaine Place Unit 3
- 3507 N Reta Ave Unit 3
- 718 W Cornelia Ave
- 3508 N Reta Ave Unit 201
- 854 W Cornelia Ave Unit 302
- 902 W Newport Ave
- 862 W Roscoe St Unit 1
- 903 W Cornelia Ave Unit 1N
- 902 W Roscoe St Unit 4
- 912 W Roscoe St Unit 1
- 835 W Buckingham Place Unit 2
- 730 W Aldine Ave Unit 3W
- 632 W Buckingham Place Unit 2E
- 3541 N Wilton Ave Unit 2
- 626 W Buckingham Place Unit 2W
- 625 W Addison St Unit 3
- 627 W Buckingham Place Unit 3
- 3519 N Sheffield Ave Unit 2N
- 555 W Cornelia Ave Unit 1711
- 743 W Cornelia Ave Unit 743S3
- 743 W Cornelia Ave Unit 743S2
- 743 W Cornelia Ave Unit 743S1
- 743 W Cornelia Ave Unit 743N3
- 743 W Cornelia Ave Unit 743N2
- 743 W Cornelia Ave Unit 743N1
- 743 W Cornelia Ave Unit N3
- 743 W Cornelia Ave Unit S1
- 743 W Cornelia Ave Unit N2
- 743 W Cornelia Ave Unit S3
- 745 W Cornelia Ave Unit 745S3
- 745 W Cornelia Ave Unit 745S2
- 745 W Cornelia Ave Unit 745S1
- 745 W Cornelia Ave Unit 745N1
- 745 W Cornelia Ave Unit 745N3
- 745 W Cornelia Ave Unit 747N3
- 745 W Cornelia Ave Unit 747N2
- 745 W Cornelia Ave Unit 747N1
- 745 W Cornelia Ave Unit 745N2
- 745 W Cornelia Ave Unit S1