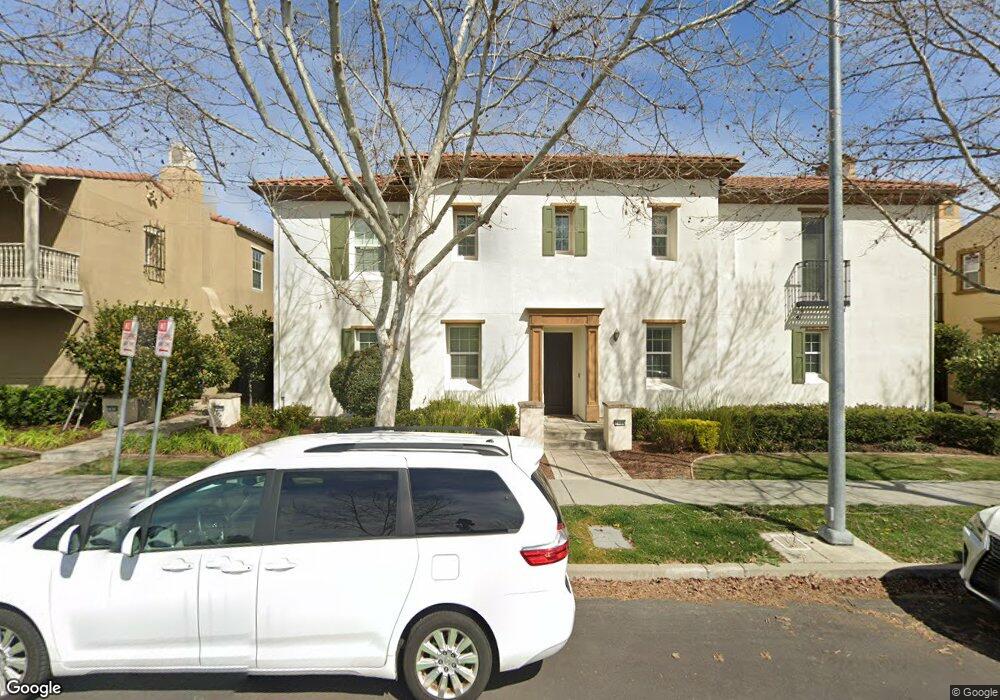
7450 Stoneleaf Rd Unit 1 San Ramon, CA 94582
Gale Ranch-Windemere NeighborhoodEstimated Value: $1,048,000 - $1,222,180
3
Beds
3
Baths
2,428
Sq Ft
$477/Sq Ft
Est. Value
About This Home
This home is located at 7450 Stoneleaf Rd Unit 1, San Ramon, CA 94582 and is currently estimated at $1,157,295, approximately $476 per square foot. 7450 Stoneleaf Rd Unit 1 is a home located in Contra Costa County with nearby schools including Quail Run Elementary School, Gale Ranch Middle School, and Dougherty Valley High School.
Ownership History
Date
Name
Owned For
Owner Type
Purchase Details
Closed on
Aug 14, 2018
Sold by
Kondapaka Narsimharao V and Akkaraj Sharanya
Bought by
Welch Michael Hunter and Welch Abigail A
Current Estimated Value
Home Financials for this Owner
Home Financials are based on the most recent Mortgage that was taken out on this home.
Original Mortgage
$405,000
Outstanding Balance
$351,726
Interest Rate
4.5%
Mortgage Type
New Conventional
Estimated Equity
$805,569
Purchase Details
Closed on
May 19, 2012
Sold by
Kondapaka Narsimharao V and Kondapaka Narsimharao
Bought by
Kondapaka Narsimharao and Akkaraj Sharanya
Purchase Details
Closed on
Sep 3, 2010
Sold by
Shapell Industries Inc
Bought by
Kondapaka Narsimharao and Akkaraj Sharanya
Home Financials for this Owner
Home Financials are based on the most recent Mortgage that was taken out on this home.
Original Mortgage
$578,843
Interest Rate
4.35%
Mortgage Type
FHA
Create a Home Valuation Report for This Property
The Home Valuation Report is an in-depth analysis detailing your home's value as well as a comparison with similar homes in the area
Home Values in the Area
Average Home Value in this Area
Purchase History
| Date | Buyer | Sale Price | Title Company |
|---|---|---|---|
| Welch Michael Hunter | $955,000 | North American Title Company | |
| Kondapaka Narsimharao | -- | None Available | |
| Kondapaka Narsimharao | $587,000 | First American Title Company |
Source: Public Records
Mortgage History
| Date | Status | Borrower | Loan Amount |
|---|---|---|---|
| Open | Welch Michael Hunter | $405,000 | |
| Previous Owner | Kondapaka Narsimharao | $578,843 |
Source: Public Records
Tax History
| Year | Tax Paid | Tax Assessment Tax Assessment Total Assessment is a certain percentage of the fair market value that is determined by local assessors to be the total taxable value of land and additions on the property. | Land | Improvement |
|---|---|---|---|---|
| 2025 | $14,441 | $1,065,316 | $474,093 | $591,223 |
| 2024 | $13,935 | $1,044,429 | $464,798 | $579,631 |
| 2023 | $13,935 | $1,023,951 | $455,685 | $568,266 |
| 2022 | $13,788 | $1,003,874 | $446,750 | $557,124 |
| 2021 | $13,442 | $984,191 | $437,991 | $546,200 |
| 2019 | $13,099 | $955,000 | $425,000 | $530,000 |
| 2018 | $9,610 | $660,496 | $267,418 | $393,078 |
| 2017 | $9,261 | $647,546 | $262,175 | $385,371 |
| 2016 | $9,107 | $634,850 | $257,035 | $377,815 |
| 2015 | $8,969 | $625,315 | $253,175 | $372,140 |
| 2014 | $8,833 | $613,067 | $248,216 | $364,851 |
Source: Public Records
Map
Nearby Homes
- 600 Thyme Way
- 3004 Sonsilla Ln
- 748 Roseum Ct
- 1195 Trumpet Vine Ln
- 5162 Rowan Dr
- 6132 Alpine Blue Dr
- 1150 Trumpet Vine Ln
- 6260 Main Branch Rd
- 193 Lucy Ln
- 2130 Elderberry Dr
- 2352 Millstream Ln
- 2094 Elderberry Dr
- 2464 Millstream Ln Unit 146
- 233 Snowdrop Ct
- 205 Zinnia Ct
- 2359 Magnolia Bridge Dr
- 2308 Cedarwood Loop
- 9831 Belladonna Dr
- 9827 Belladonna Dr
- 112 Begonia Ct
- 7450 Stoneleaf Rd Unit 123
- 7446 Stoneleaf Rd
- 7442 Stoneleaf Rd
- 7454 Stoneleaf Rd Unit 132
- 7458 Stoneleaf Rd
- 7438 Stoneleaf Rd
- 7462 Stoneleaf Rd
- 7434 Stoneleaf Rd
- 7430 Stoneleaf Rd
- 4673 Malayan St
- 4685 Malayan St
- 4661 Malayan St
- 4649 Malayan St
- 4697 Malayan St
- 7426 Stoneleaf Rd
- 7422 Stoneleaf Rd Unit 1
- 7422 Stoneleaf Rd
- 4637 Malayan St
- 7418 Stoneleaf Rd
- 7478 Stoneleaf Rd
Your Personal Tour Guide
Ask me questions while you tour the home.