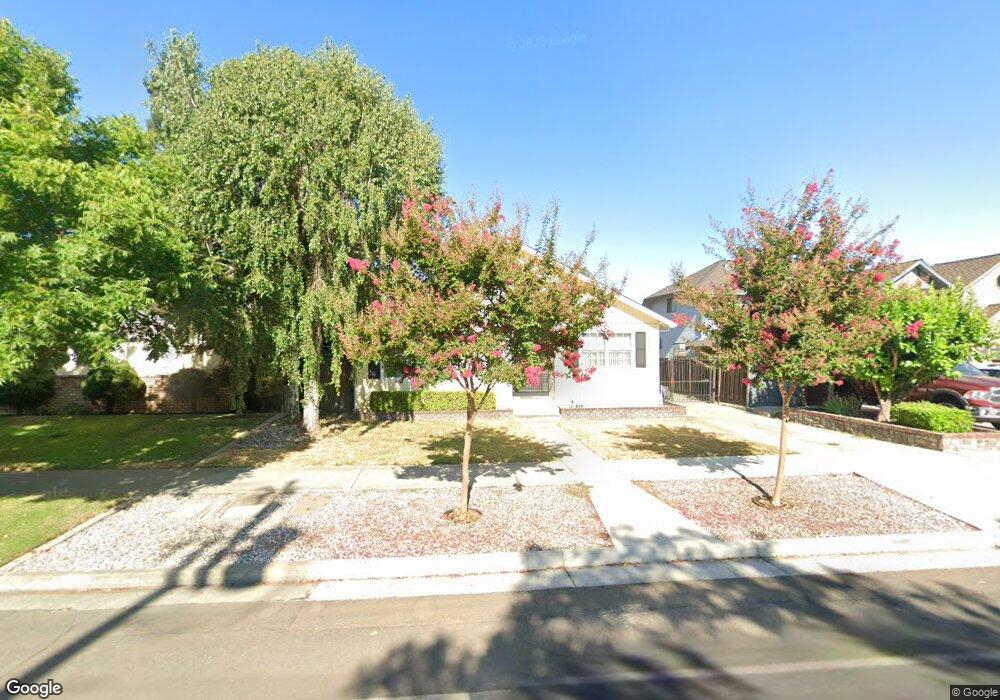
7451 Miller Ave Gilroy, CA 95020
Estimated Value: $1,048,000 - $1,184,000
4
Beds
3
Baths
2,060
Sq Ft
$528/Sq Ft
Est. Value
About This Home
This home is located at 7451 Miller Ave, Gilroy, CA 95020 and is currently estimated at $1,088,234, approximately $528 per square foot. 7451 Miller Ave is a home located in Santa Clara County with nearby schools including El Roble Elementary School, Brownell Middle School, and Solorsano Middle School.
Ownership History
Date
Name
Owned For
Owner Type
Purchase Details
Closed on
Sep 11, 2023
Sold by
Crowell Dale and Crowell Colette
Bought by
Crowell 2023 Revocable Trust and Crowell
Current Estimated Value
Purchase Details
Closed on
Sep 10, 1999
Sold by
Ohman Barbara Trustee
Bought by
Crowell Dale and Crowell Colette
Purchase Details
Closed on
Nov 12, 1996
Sold by
Maxfield John A and Maxfield Julie M
Bought by
Ohman Barbara
Purchase Details
Closed on
Apr 6, 1994
Sold by
Kahl Calvin
Bought by
Maxfield John Arthur and Maxfield Julie Marie
Home Financials for this Owner
Home Financials are based on the most recent Mortgage that was taken out on this home.
Original Mortgage
$194,800
Interest Rate
7.38%
Create a Home Valuation Report for This Property
The Home Valuation Report is an in-depth analysis detailing your home's value as well as a comparison with similar homes in the area
Home Values in the Area
Average Home Value in this Area
Purchase History
| Date | Buyer | Sale Price | Title Company |
|---|---|---|---|
| Crowell 2023 Revocable Trust | -- | None Listed On Document | |
| Crowell Dale | $359,000 | Fidelity National Title Co | |
| Ohman Barbara | $240,000 | American Title Ins Co | |
| Maxfield John Arthur | $216,500 | Old Republic Title Company |
Source: Public Records
Mortgage History
| Date | Status | Borrower | Loan Amount |
|---|---|---|---|
| Previous Owner | Maxfield John Arthur | $194,800 |
Source: Public Records
Tax History Compared to Growth
Tax History
| Year | Tax Paid | Tax Assessment Tax Assessment Total Assessment is a certain percentage of the fair market value that is determined by local assessors to be the total taxable value of land and additions on the property. | Land | Improvement |
|---|---|---|---|---|
| 2025 | $7,019 | $580,702 | $220,699 | $360,003 |
| 2024 | $7,019 | $569,317 | $216,372 | $352,945 |
| 2023 | $6,976 | $558,155 | $212,130 | $346,025 |
| 2022 | $6,860 | $547,212 | $207,971 | $339,241 |
| 2021 | $6,828 | $536,484 | $203,894 | $332,590 |
| 2020 | $6,752 | $530,984 | $201,804 | $329,180 |
| 2019 | $6,688 | $520,574 | $197,848 | $322,726 |
| 2018 | $6,244 | $510,368 | $193,969 | $316,399 |
| 2017 | $6,374 | $500,362 | $190,166 | $310,196 |
| 2016 | $6,243 | $490,552 | $186,438 | $304,114 |
| 2015 | $5,890 | $483,184 | $183,638 | $299,546 |
| 2014 | $5,851 | $473,720 | $180,041 | $293,679 |
Source: Public Records
Map
Nearby Homes
- 7379 Ailes Ct Unit Homesite 3
- 7363 Ailes Ct Unit Homesite 5
- 7376 Ailes Ct Unit Homesite 10
- 7360 Ailes Ct Unit Homesite 8
- 7391 Princevalle St Unit Homesite 13
- 7352 Ailes Ct Unit Homesite 7
- 7359 Princevalle St Unit Homesite 17
- 7681 Rea St
- 7351 Princevalle St Unit Homesite 18
- Plan 2 at Heritage on 6th Street
- Plan 1 at Heritage on 6th Street
- 7343 Princevalle St Unit Homesite 19
- 7305 Chadwick St
- 7245 Trenton Place
- 7210 Yorktown Dr
- 7620 Santa Paula Dr
- 7609 Santa Paula Dr
- 970 Ortega Cir
- 775 Williamsburg Way Unit B
- 771 Williamsburg Way Unit C
- 7461 Miller Ave
- 7441 Miller Ave
- 7471 Miller Ave
- 7460 Filice Dr
- 7440 Filice Dr
- 7431 Miller Ave
- 7480 Filice Dr Unit 10
- 7430 Filice Dr
- 7460 Miller Ave
- 7500 Filice Dr
- 7495 Miller Ave
- 7420 Filice Dr
- 7421 Miller Ave
- 7440 Miller Ave
- 7490 Miller Ave
- 7510 Filice Dr
- 831 Eschenburg Dr
- 7461 Filice Dr
- 7411 Miller Ave
- 7441 Filice Dr