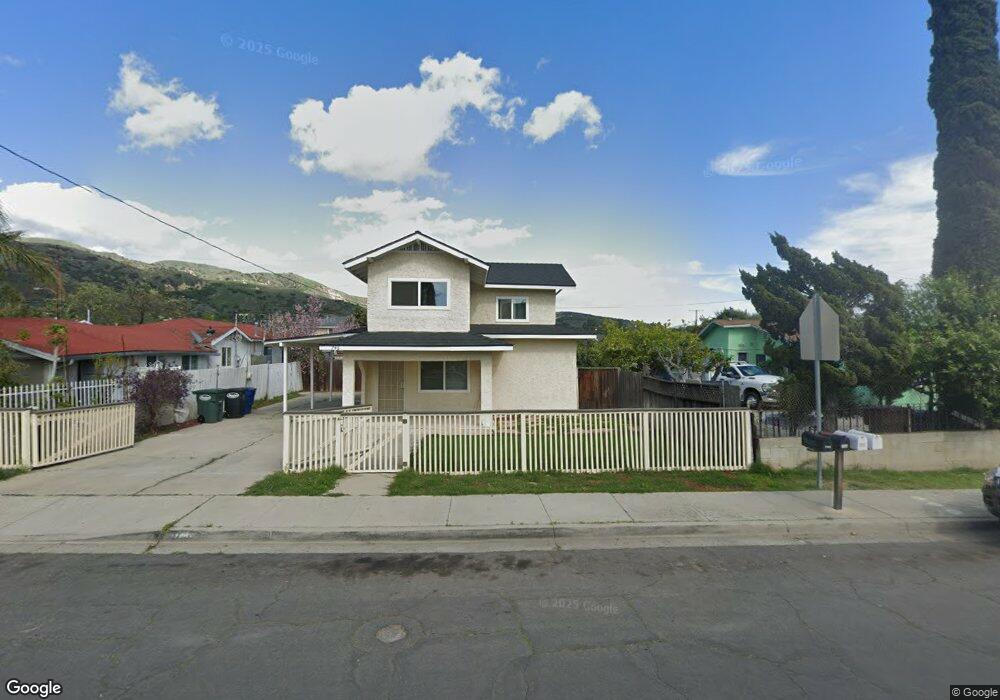
746 B St Fillmore, CA 93015
Estimated Value: $194,000 - $582,000
1
Bed
1
Bath
675
Sq Ft
$691/Sq Ft
Est. Value
About This Home
This home is located at 746 B St, Fillmore, CA 93015 and is currently estimated at $466,492, approximately $691 per square foot. 746 B St is a home located in Ventura County with nearby schools including Fillmore Senior High.
Ownership History
Date
Name
Owned For
Owner Type
Purchase Details
Closed on
Sep 12, 2005
Sold by
Ayala Rigoberto
Bought by
Ayala Rigoberto and Ayala Leticia
Current Estimated Value
Purchase Details
Closed on
Nov 22, 2004
Sold by
Ayala Arnulfo
Bought by
Ayala Rigoberto
Home Financials for this Owner
Home Financials are based on the most recent Mortgage that was taken out on this home.
Original Mortgage
$103,000
Interest Rate
5.64%
Mortgage Type
Purchase Money Mortgage
Purchase Details
Closed on
Jul 22, 2002
Sold by
Mercado Lupe C
Bought by
Ayala Rigoberto and Ayala Arnulfo
Home Financials for this Owner
Home Financials are based on the most recent Mortgage that was taken out on this home.
Original Mortgage
$54,150
Interest Rate
6.37%
Create a Home Valuation Report for This Property
The Home Valuation Report is an in-depth analysis detailing your home's value as well as a comparison with similar homes in the area
Home Values in the Area
Average Home Value in this Area
Purchase History
| Date | Buyer | Sale Price | Title Company |
|---|---|---|---|
| Ayala Rigoberto | -- | -- | |
| Ayala Rigoberto | $51,500 | Old Republic Title Company | |
| Ayala Rigoberto | $57,000 | Stewart Title Company |
Source: Public Records
Mortgage History
| Date | Status | Borrower | Loan Amount |
|---|---|---|---|
| Closed | Ayala Rigoberto | $103,000 | |
| Previous Owner | Ayala Rigoberto | $54,150 |
Source: Public Records
Tax History
| Year | Tax Paid | Tax Assessment Tax Assessment Total Assessment is a certain percentage of the fair market value that is determined by local assessors to be the total taxable value of land and additions on the property. | Land | Improvement |
|---|---|---|---|---|
| 2025 | $2,098 | $194,312 | $148,661 | $45,651 |
| 2024 | $2,098 | $190,502 | $145,746 | $44,756 |
| 2023 | $2,069 | $186,767 | $142,888 | $43,879 |
| 2022 | $1,911 | $183,105 | $140,086 | $43,019 |
| 2021 | $2,170 | $179,515 | $137,339 | $42,176 |
| 2020 | $2,013 | $177,677 | $135,932 | $41,745 |
| 2019 | $2,018 | $174,194 | $133,267 | $40,927 |
| 2018 | $1,976 | $170,779 | $130,654 | $40,125 |
| 2017 | $1,986 | $167,432 | $128,093 | $39,339 |
| 2016 | $1,838 | $164,150 | $125,582 | $38,568 |
| 2015 | $1,786 | $161,687 | $123,697 | $37,990 |
| 2014 | $1,784 | $158,522 | $121,275 | $37,247 |
Source: Public Records
Map
Nearby Homes
- 831 Blaine Ave
- 949 Blaine Ave
- 815 Woodgrove Rd
- 809 Woodgrove Rd
- 600 C St
- 1106 Mockingbird Ln
- 313 C St
- 404 Central Ave
- 345 Blaine Ave
- 340 Central Ave
- 1262 Sespe Ave
- 639 Mountain View St
- 318 Bard St
- 320 D St
- 1163 W Ventura St
- 616 Island View St
- 578 Apricot Ln
- 228 Parkhaven Ct
- 549 Heritage Valley Pkwy
- 513 Heritage Valley Pkwy
Your Personal Tour Guide
Ask me questions while you tour the home.