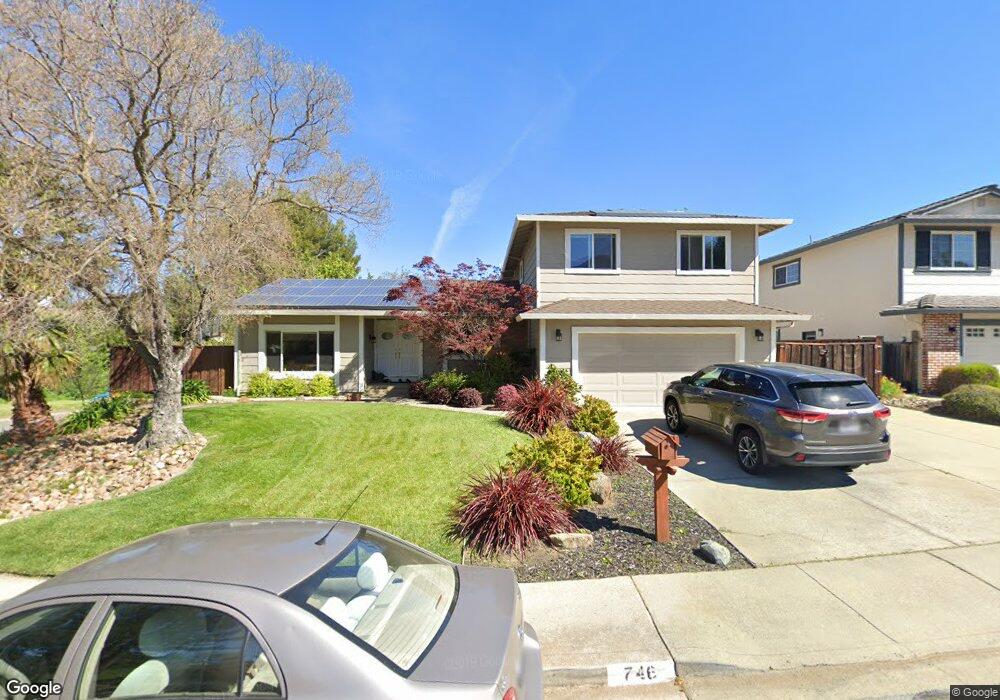
746 Bloching Cir Clayton, CA 94517
Estimated Value: $1,226,000 - $1,338,000
4
Beds
3
Baths
2,325
Sq Ft
$552/Sq Ft
Est. Value
About This Home
This home is located at 746 Bloching Cir, Clayton, CA 94517 and is currently estimated at $1,284,423, approximately $552 per square foot. 746 Bloching Cir is a home located in Contra Costa County with nearby schools including Mt. Diablo Elementary School, Diablo View Middle School, and College Park High School.
Ownership History
Date
Name
Owned For
Owner Type
Purchase Details
Closed on
Sep 3, 2020
Sold by
Agnew Brett T and Agnew Elise J
Bought by
Agnew Brett T and Agnew Elise J
Current Estimated Value
Purchase Details
Closed on
May 10, 2006
Sold by
Reyes Jess A and Reyes Katrina Couchot
Bought by
Agnew Brett T and Agnew Elise J
Home Financials for this Owner
Home Financials are based on the most recent Mortgage that was taken out on this home.
Original Mortgage
$719,000
Outstanding Balance
$414,029
Interest Rate
6.3%
Mortgage Type
Purchase Money Mortgage
Estimated Equity
$870,394
Purchase Details
Closed on
Mar 23, 1999
Sold by
Fitzgerald Dirk P and Fitzgerald Marilynn S
Bought by
Reyes Jess A and Reyes Katrina Couchot
Home Financials for this Owner
Home Financials are based on the most recent Mortgage that was taken out on this home.
Original Mortgage
$292,000
Interest Rate
6.79%
Mortgage Type
Purchase Money Mortgage
Create a Home Valuation Report for This Property
The Home Valuation Report is an in-depth analysis detailing your home's value as well as a comparison with similar homes in the area
Home Values in the Area
Average Home Value in this Area
Purchase History
| Date | Buyer | Sale Price | Title Company |
|---|---|---|---|
| Agnew Brett T | -- | None Available | |
| Agnew Brett T | $899,000 | Fidelity National Title Co | |
| Reyes Jess A | $365,000 | Placer Title Company |
Source: Public Records
Mortgage History
| Date | Status | Borrower | Loan Amount |
|---|---|---|---|
| Open | Agnew Brett T | $719,000 | |
| Previous Owner | Reyes Jess A | $292,000 | |
| Closed | Reyes Jess A | $36,500 |
Source: Public Records
Tax History
| Year | Tax Paid | Tax Assessment Tax Assessment Total Assessment is a certain percentage of the fair market value that is determined by local assessors to be the total taxable value of land and additions on the property. | Land | Improvement |
|---|---|---|---|---|
| 2025 | $14,830 | $1,228,543 | $581,745 | $646,798 |
| 2024 | $14,226 | $1,204,455 | $570,339 | $634,116 |
| 2023 | $14,226 | $1,180,839 | $559,156 | $621,683 |
| 2022 | $14,060 | $1,157,687 | $548,193 | $609,494 |
| 2021 | $12,217 | $999,000 | $473,000 | $526,000 |
| 2019 | $11,307 | $909,000 | $430,434 | $478,566 |
| 2018 | $10,487 | $855,000 | $404,864 | $450,136 |
| 2017 | $10,225 | $845,000 | $400,129 | $444,871 |
| 2016 | $9,710 | $805,000 | $381,188 | $423,812 |
| 2015 | $8,598 | $701,000 | $331,941 | $369,059 |
| 2014 | $7,691 | $618,500 | $292,876 | $325,624 |
Source: Public Records
Map
Nearby Homes
- 785 Bloching Cir
- 23 Capistrano Ct
- 510 Mt Davidson Ct
- 305 Mountaire Pkwy
- 4 Mt Wilson Way
- 367 Mt Washington Way
- 258 El Pueblo Place
- 218 Mountaire Cir
- 321 Semillon Cir
- 500 Douglas Rd
- 5900 High St
- 1105 Peacock Creek Dr
- 5817 Mitchell Canyon Ct
- 1383 Shell Ln
- 5722 Roanwood Way
- 57 Karkin Place
- 376 Blue Oak Ln
- 362 Blue Oak Ln
- 5535 Merritt Dr
- 1421 Lydia Ln
- 752 Bloching Cir
- 741 Bloching Cir
- 758 Bloching Cir
- 747 Bloching Cir
- 753 Bloching Cir
- 729 Bloching Cir
- 759 Bloching Cir
- 764 Bloching Cir
- 765 Bloching Cir
- 723 Bloching Cir
- 738 Bloching Cir
- 770 Bloching Cir
- 726 Bloching Cir
- 771 Bloching Cir
- 717 Bloching Cir
- 18 Casa Verde Place
- 720 Bloching Cir
- 231 Mountaire Pkwy
- 312 Mt Palomar Place
- 235 Mountaire Pkwy
Your Personal Tour Guide
Ask me questions while you tour the home.