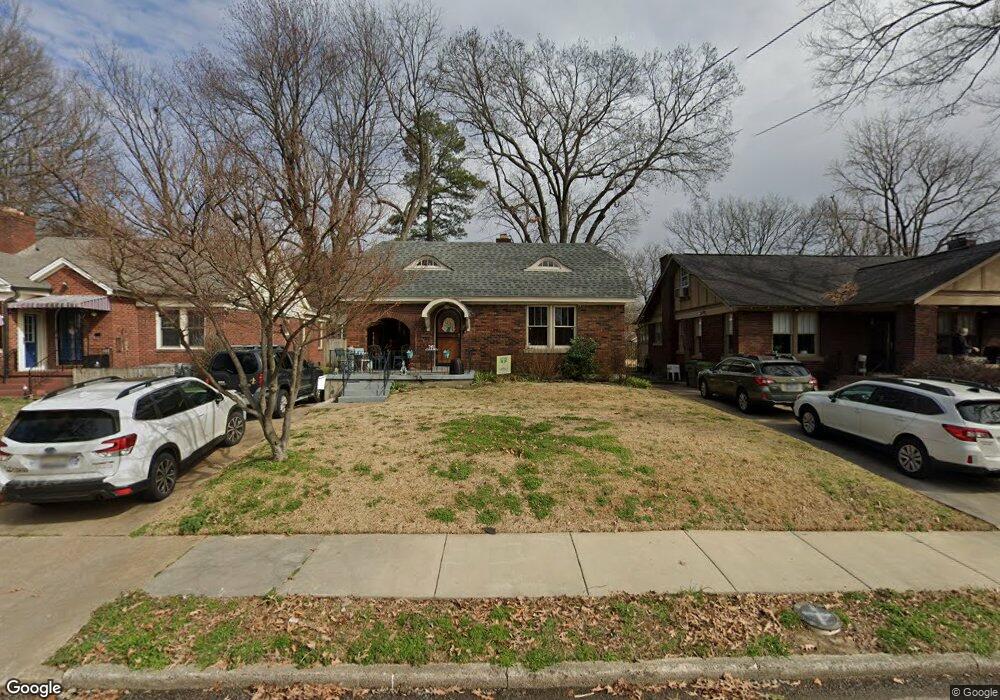
746 N Evergreen St Memphis, TN 38107
Vollintine Evergreen NeighborhoodEstimated Value: $221,470 - $290,000
2
Beds
1
Bath
1,641
Sq Ft
$152/Sq Ft
Est. Value
About This Home
This home is located at 746 N Evergreen St, Memphis, TN 38107 and is currently estimated at $248,618, approximately $151 per square foot. 746 N Evergreen St is a home located in Shelby County with nearby schools including Snowden Elementary/Middle School, Manassas High School, and Perea Elementary School.
Ownership History
Date
Name
Owned For
Owner Type
Purchase Details
Closed on
Feb 10, 2010
Sold by
Ruder Melissa A
Bought by
Sullins Patricia and Sullins Steven S
Current Estimated Value
Home Financials for this Owner
Home Financials are based on the most recent Mortgage that was taken out on this home.
Original Mortgage
$145,319
Outstanding Balance
$98,411
Interest Rate
5.5%
Mortgage Type
FHA
Estimated Equity
$150,207
Purchase Details
Closed on
Jan 11, 2008
Sold by
Peak Nathan A and Peak Corrie A Shaw
Bought by
Ruder Melissa A
Home Financials for this Owner
Home Financials are based on the most recent Mortgage that was taken out on this home.
Original Mortgage
$130,500
Interest Rate
5.94%
Mortgage Type
Purchase Money Mortgage
Purchase Details
Closed on
Nov 30, 2001
Sold by
Marx Kraus Cindy
Bought by
Peak Nathan A and Shaw Corrie A
Home Financials for this Owner
Home Financials are based on the most recent Mortgage that was taken out on this home.
Original Mortgage
$104,176
Interest Rate
6.6%
Mortgage Type
FHA
Create a Home Valuation Report for This Property
The Home Valuation Report is an in-depth analysis detailing your home's value as well as a comparison with similar homes in the area
Home Values in the Area
Average Home Value in this Area
Purchase History
| Date | Buyer | Sale Price | Title Company |
|---|---|---|---|
| Sullins Patricia | $148,000 | Alliance Title & Escrow Llc | |
| Ruder Melissa A | $130,500 | None Available | |
| Peak Nathan A | $105,000 | -- |
Source: Public Records
Mortgage History
| Date | Status | Borrower | Loan Amount |
|---|---|---|---|
| Open | Sullins Patricia | $145,319 | |
| Previous Owner | Ruder Melissa A | $130,500 | |
| Previous Owner | Peak Nathan A | $104,176 |
Source: Public Records
Tax History Compared to Growth
Tax History
| Year | Tax Paid | Tax Assessment Tax Assessment Total Assessment is a certain percentage of the fair market value that is determined by local assessors to be the total taxable value of land and additions on the property. | Land | Improvement |
|---|---|---|---|---|
| 2025 | $1,604 | $52,525 | $12,225 | $40,300 |
| 2024 | $1,604 | $47,325 | $7,850 | $39,475 |
| 2023 | $2,883 | $47,325 | $7,850 | $39,475 |
| 2022 | $2,883 | $47,325 | $7,850 | $39,475 |
| 2021 | $2,917 | $47,325 | $7,850 | $39,475 |
| 2020 | $2,661 | $36,725 | $7,850 | $28,875 |
| 2019 | $2,661 | $36,725 | $7,850 | $28,875 |
| 2018 | $2,661 | $36,725 | $7,850 | $28,875 |
| 2017 | $1,509 | $36,725 | $7,850 | $28,875 |
| 2016 | $1,409 | $32,250 | $0 | $0 |
| 2014 | $1,409 | $32,250 | $0 | $0 |
Source: Public Records
Map
Nearby Homes
- 715 N Auburndale St
- 735 Hawthorne St
- 706 N Belvedere Blvd
- 729 N Belvedere Blvd
- 710 Dickinson St
- 699 Dickinson St
- 670 N Avalon St
- 1853 Lyndale Ave
- 1700 Faxon Ave
- 815 N Avalon St
- 579 N Evergreen St
- 1877 Lyndale Ave
- 830 Maury St
- 914 N Auburndale St
- 1576 Tutwiler Ave
- 740 N Willett St
- 883 N Mclean Blvd
- 930 N Belvedere Blvd
- 1900 Snowden Ave
- 889 N Avalon St
- 740 N Evergreen St
- 750 N Evergreen St
- 756 N Evergreen St
- 736 N Evergreen St
- 760 N Evergreen St
- 745 N Auburndale St
- 730 N Evergreen St
- 749 N Auburndale St
- 739 N Auburndale St
- 755 N Auburndale St
- 735 N Auburndale St
- 766 N Evergreen St
- 766 N Evergreen
- 726 N Evergreen St
- 759 N Auburndale St
- 745 N Evergreen St
- 729 N Auburndale St
- 739 N Evergreen St
- 751 N Evergreen St
- 733 N Evergreen St