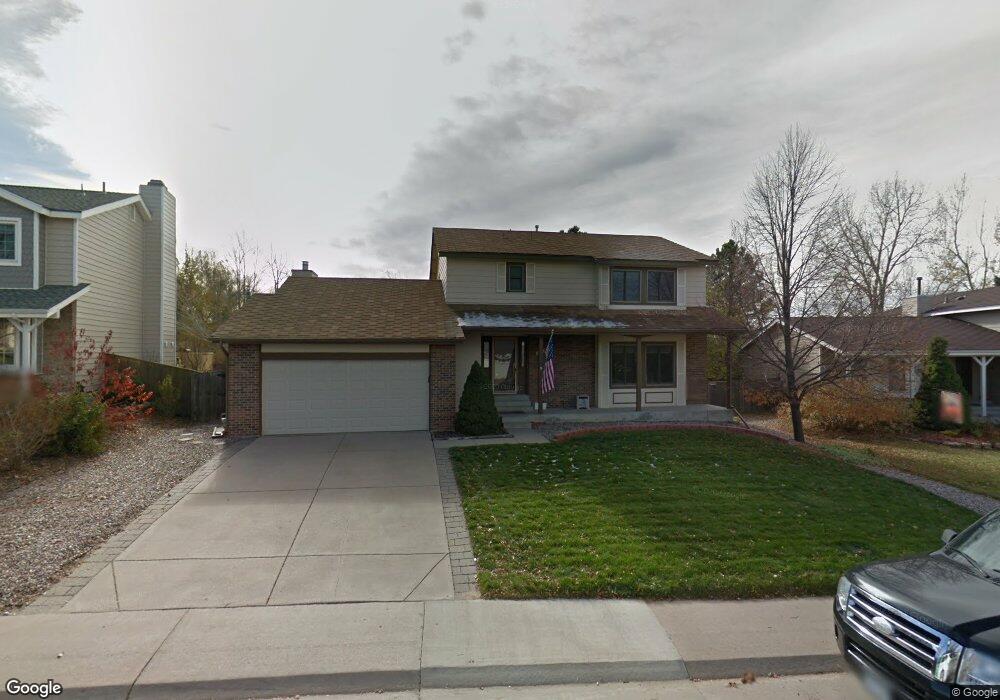
746 Northridge Rd Highlands Ranch, CO 80126
Northridge NeighborhoodEstimated Value: $687,000 - $730,000
5
Beds
4
Baths
3,285
Sq Ft
$217/Sq Ft
Est. Value
About This Home
This home is located at 746 Northridge Rd, Highlands Ranch, CO 80126 and is currently estimated at $714,481, approximately $217 per square foot. 746 Northridge Rd is a home located in Douglas County with nearby schools including Northridge Elementary School, Mountain Ridge Middle School, and Mountain Vista High School.
Ownership History
Date
Name
Owned For
Owner Type
Purchase Details
Closed on
Mar 31, 2016
Sold by
Wichter Mary K
Bought by
Aliaga Vanessa and Rivas Hidalgo Jesus
Current Estimated Value
Home Financials for this Owner
Home Financials are based on the most recent Mortgage that was taken out on this home.
Original Mortgage
$418,185
Outstanding Balance
$338,298
Interest Rate
4.25%
Mortgage Type
FHA
Estimated Equity
$376,183
Purchase Details
Closed on
Jul 23, 2015
Sold by
Wichter Mary K
Bought by
Wichter Mary K
Purchase Details
Closed on
Jan 2, 2003
Sold by
Wichter Howard I
Bought by
Wichter Howard I
Home Financials for this Owner
Home Financials are based on the most recent Mortgage that was taken out on this home.
Original Mortgage
$130,000
Interest Rate
6.16%
Purchase Details
Closed on
Oct 18, 1983
Sold by
Mission Viejo Co
Bought by
Wichter Howard I
Create a Home Valuation Report for This Property
The Home Valuation Report is an in-depth analysis detailing your home's value as well as a comparison with similar homes in the area
Home Values in the Area
Average Home Value in this Area
Purchase History
| Date | Buyer | Sale Price | Title Company |
|---|---|---|---|
| Aliaga Vanessa | $425,900 | Land Title Guarantee | |
| Wichter Mary K | -- | None Available | |
| Wichter Howard I | -- | Multiple | |
| Wichter Howard I | $133,000 | -- |
Source: Public Records
Mortgage History
| Date | Status | Borrower | Loan Amount |
|---|---|---|---|
| Open | Aliaga Vanessa | $418,185 | |
| Previous Owner | Wichter Howard I | $130,000 |
Source: Public Records
Tax History Compared to Growth
Tax History
| Year | Tax Paid | Tax Assessment Tax Assessment Total Assessment is a certain percentage of the fair market value that is determined by local assessors to be the total taxable value of land and additions on the property. | Land | Improvement |
|---|---|---|---|---|
| 2024 | $4,274 | $49,030 | $10,660 | $38,370 |
| 2023 | $4,267 | $49,030 | $10,660 | $38,370 |
| 2022 | $3,238 | $35,440 | $7,250 | $28,190 |
| 2021 | $3,368 | $35,440 | $7,250 | $28,190 |
| 2020 | $3,107 | $33,500 | $6,940 | $26,560 |
| 2019 | $3,118 | $33,500 | $6,940 | $26,560 |
| 2018 | $2,765 | $29,260 | $6,060 | $23,200 |
| 2017 | $2,518 | $29,260 | $6,060 | $23,200 |
| 2016 | $2,159 | $24,620 | $5,910 | $18,710 |
| 2015 | $1,103 | $24,620 | $5,910 | $18,710 |
| 2014 | $939 | $19,360 | $4,940 | $14,420 |
Source: Public Records
Map
Nearby Homes
- 904 Fieldstone Place
- 8473 Tanglewood St
- 714 Old Stone Dr
- 507 Fox Hunt Cir
- 8822 Eagles Nest Ln
- 8725 Meadowlark Cir
- 8745 Meadowlark Cir
- 804 Homestead Dr
- 1241 Northcrest Dr
- 843 Homestead Dr
- 8397 Cobblestone Ct
- 8376 Cobblestone St
- 1384 Briar Cir
- 1186 Cobblestone Dr
- 8441 Timberwood St
- 8606 Meadowlark Cir
- 1431 Northcrest Dr
- 1551 Northridge Dr
- 8823 Maplewood Dr
- 9050 Hunters Creek St
- 756 Northridge Rd
- 736 Northridge Rd
- 653 Sage Cir
- 643 Sage Cir
- 726 Northridge Rd
- 786 Northridge Rd
- 785 Old Stone Dr
- 765 Northridge Rd
- 745 Northridge Rd
- 633 Sage Cir
- 785 Northridge Rd
- 663 Sage Cir
- 775 Old Stone Dr
- 725 Northridge Rd
- 700 Northridge Rd
- 623 Sage Cir
- 765 Old Stone Dr
- 734 Honeysuckle Place
- 705 Northridge Rd
- 603 Sage Cir