746 W Main St Plainfield, MA 01070
Estimated Value: $516,000 - $860,000
3
Beds
3
Baths
2,800
Sq Ft
$229/Sq Ft
Est. Value
About This Home
This home is located at 746 W Main St, Plainfield, MA 01070 and is currently estimated at $641,708, approximately $229 per square foot. 746 W Main St is a home located in Hampshire County with nearby schools including Mohawk Trail Regional High School.
Ownership History
Date
Name
Owned For
Owner Type
Purchase Details
Closed on
Oct 5, 2023
Sold by
Robbins Lynne C and Robbins Lewis C
Bought by
Robbins Michael A
Current Estimated Value
Purchase Details
Closed on
Nov 13, 2003
Sold by
Carrey N Frolick Ret and Frolick
Bought by
Robbins Lewis C and Robbins Lynne C
Create a Home Valuation Report for This Property
The Home Valuation Report is an in-depth analysis detailing your home's value as well as a comparison with similar homes in the area
Home Values in the Area
Average Home Value in this Area
Purchase History
| Date | Buyer | Sale Price | Title Company |
|---|---|---|---|
| Robbins Michael A | -- | None Available | |
| Robbins Michael A | -- | None Available | |
| Robbins Lewis C | $322,500 | -- | |
| Robbins Lewis C | $322,500 | -- |
Source: Public Records
Mortgage History
| Date | Status | Borrower | Loan Amount |
|---|---|---|---|
| Previous Owner | Robbins Lewis C | $100,000 | |
| Previous Owner | Robbins Lewis C | $60,000 | |
| Previous Owner | Robbins Lewis C | $60,000 |
Source: Public Records
Tax History
| Year | Tax Paid | Tax Assessment Tax Assessment Total Assessment is a certain percentage of the fair market value that is determined by local assessors to be the total taxable value of land and additions on the property. | Land | Improvement |
|---|---|---|---|---|
| 2025 | $7,752 | $419,500 | $113,500 | $306,000 |
| 2024 | $7,690 | $359,000 | $113,500 | $245,500 |
| 2023 | $7,438 | $359,000 | $113,500 | $245,500 |
| 2022 | $7,162 | $359,000 | $113,500 | $245,500 |
| 2021 | $6,780 | $352,400 | $112,200 | $240,200 |
| 2020 | $7,058 | $350,800 | $113,700 | $237,100 |
| 2019 | $7,570 | $389,800 | $185,700 | $204,100 |
| 2018 | $6,668 | $349,500 | $138,900 | $210,600 |
| 2017 | $6,291 | $323,300 | $102,500 | $220,800 |
| 2016 | $6,094 | $323,100 | $102,300 | $220,800 |
| 2015 | $5,709 | $320,200 | $108,000 | $212,200 |
| 2014 | $5,496 | $307,400 | $107,300 | $200,100 |
Source: Public Records
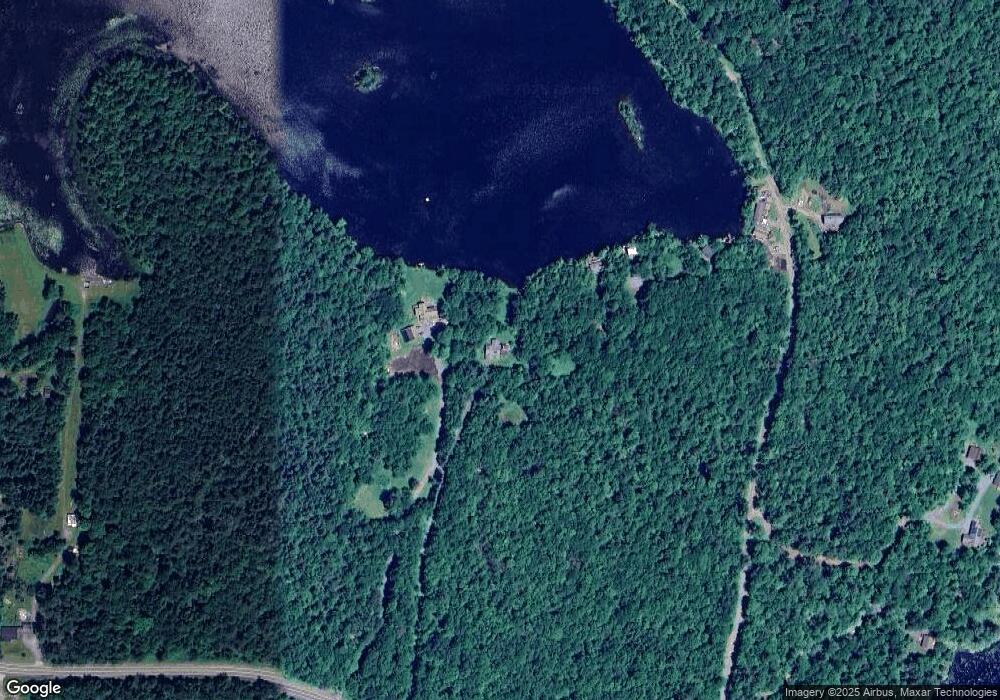
Map
Nearby Homes
Your Personal Tour Guide
Ask me questions while you tour the home.