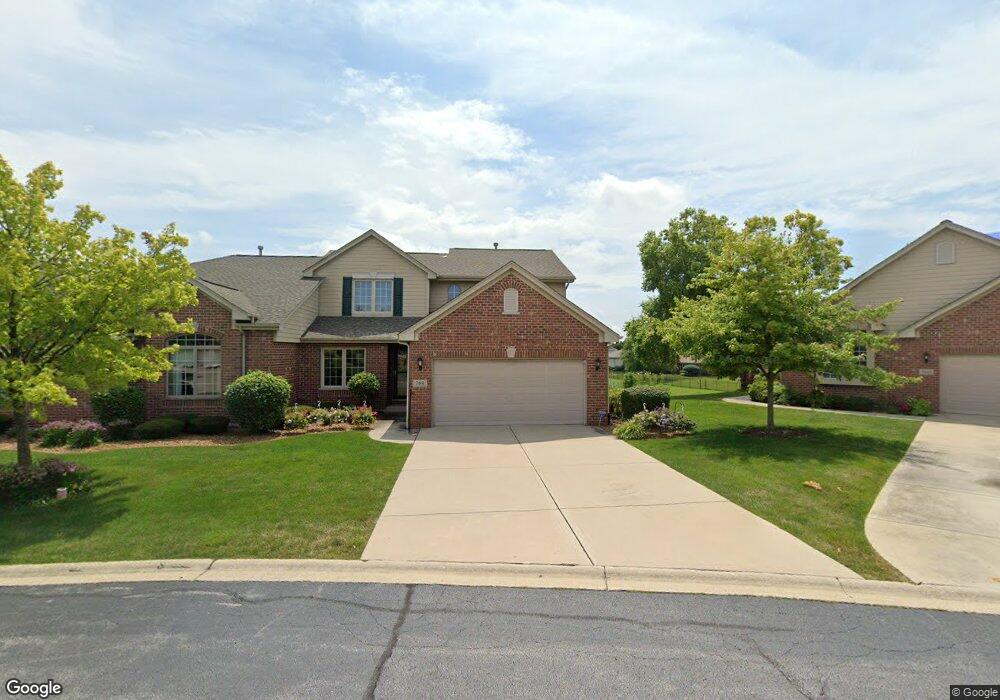
7461 E Plank Trail Ct Frankfort, IL 60423
Frankfort Square NeighborhoodEstimated Value: $404,000 - $479,000
4
Beds
3
Baths
2,022
Sq Ft
$212/Sq Ft
Est. Value
About This Home
This home is located at 7461 E Plank Trail Ct, Frankfort, IL 60423 and is currently estimated at $428,043, approximately $211 per square foot. 7461 E Plank Trail Ct is a home located in Will County with nearby schools including Indian Trail Elementary School, Summit Hill Junior High School, and Lincoln-Way East High School.
Ownership History
Date
Name
Owned For
Owner Type
Purchase Details
Closed on
May 22, 2019
Sold by
Fortier Cheryl
Bought by
Fortier Cheryl and Jaros Mark
Current Estimated Value
Home Financials for this Owner
Home Financials are based on the most recent Mortgage that was taken out on this home.
Original Mortgage
$228,400
Outstanding Balance
$200,402
Interest Rate
4.1%
Mortgage Type
New Conventional
Estimated Equity
$227,641
Purchase Details
Closed on
Jun 16, 2010
Sold by
Ross Karim and Ross Jocelyn
Bought by
Fortier Cheryl A
Home Financials for this Owner
Home Financials are based on the most recent Mortgage that was taken out on this home.
Original Mortgage
$256,545
Interest Rate
3.75%
Mortgage Type
FHA
Purchase Details
Closed on
Oct 31, 2003
Sold by
First United Bank
Bought by
Ross Karim and Ross Jocelyn
Home Financials for this Owner
Home Financials are based on the most recent Mortgage that was taken out on this home.
Original Mortgage
$255,200
Interest Rate
4.87%
Mortgage Type
Purchase Money Mortgage
Create a Home Valuation Report for This Property
The Home Valuation Report is an in-depth analysis detailing your home's value as well as a comparison with similar homes in the area
Home Values in the Area
Average Home Value in this Area
Purchase History
| Date | Buyer | Sale Price | Title Company |
|---|---|---|---|
| Fortier Cheryl | -- | Fidelity National Title | |
| Fortier Cheryl A | $260,000 | First American | |
| Ross Karim | $277,500 | -- |
Source: Public Records
Mortgage History
| Date | Status | Borrower | Loan Amount |
|---|---|---|---|
| Open | Fortier Cheryl | $228,400 | |
| Closed | Fortier Cheryl A | $256,545 | |
| Previous Owner | Ross Karim | $255,200 |
Source: Public Records
Tax History
| Year | Tax Paid | Tax Assessment Tax Assessment Total Assessment is a certain percentage of the fair market value that is determined by local assessors to be the total taxable value of land and additions on the property. | Land | Improvement |
|---|---|---|---|---|
| 2024 | $10,230 | $125,151 | $780 | $124,371 |
| 2023 | $10,230 | $111,772 | $697 | $111,075 |
| 2022 | $9,060 | $101,805 | $635 | $101,170 |
| 2021 | $8,499 | $95,243 | $594 | $94,649 |
| 2020 | $8,364 | $92,559 | $577 | $91,982 |
| 2019 | $8,085 | $90,082 | $562 | $89,520 |
| 2018 | $7,661 | $86,149 | $546 | $85,603 |
| 2017 | $7,497 | $84,138 | $533 | $83,605 |
| 2016 | $7,262 | $81,254 | $515 | $80,739 |
| 2015 | $6,996 | $78,393 | $497 | $77,896 |
| 2014 | $6,996 | $77,849 | $494 | $77,355 |
| 2013 | $6,996 | $90,309 | $1,986 | $88,323 |
Source: Public Records
Map
Nearby Homes
- 21295 Longview Dr
- 7676 Thistlewood Ln
- 21000 S Frankfort Square Rd
- 7324 Heritage Ct Unit 2D
- 7537 W Wishing Well Dr
- 20618 S Driftwood Dr
- 7458 W Wishing Well Dr
- 20552 S Frankfort Square Rd
- 20538 S Frankfort Square Rd
- 7913 Wheatfield Dr
- 20513 S Acorn Ridge Dr
- 557 Aberdeen Rd
- 21122 S Hillside Rd
- 6704 Bridle Path Dr
- 0 S Harlem Ave
- 241 Blackthorn Rd
- 352 Wild Rock Terrace
- 7406 W Quail Cir
- 300 Briarbranch Terrace
- Lot 223 S River Rd
- 7461 E Plank Trail Ct
- 7453 E Plank Trail Ct
- 7469 E Plank Trail Ct
- 7445 E Plank Trail Ct
- 7477 E Plank Trail Ct
- 7437 E Plank Trail Ct
- 7468 E Plank Trail Ct
- 7485 E Plank Trail Ct
- 7460 E Plank Trail Ct
- 7476 E Plank Trail Ct
- 7493 E Plank Trail Ct
- 7452 E Plank Trail Ct
- 7429 E Plank Trail Ct
- 7484 E Plank Trail Ct
- 7444 E Plank Trail Ct
- 7501 E Plank Trail Ct
- 7421 E Plank Trail Ct
- 21243 Brittany Dr
- 21227 Brittany Dr
- 7413 E Plank Trail Ct