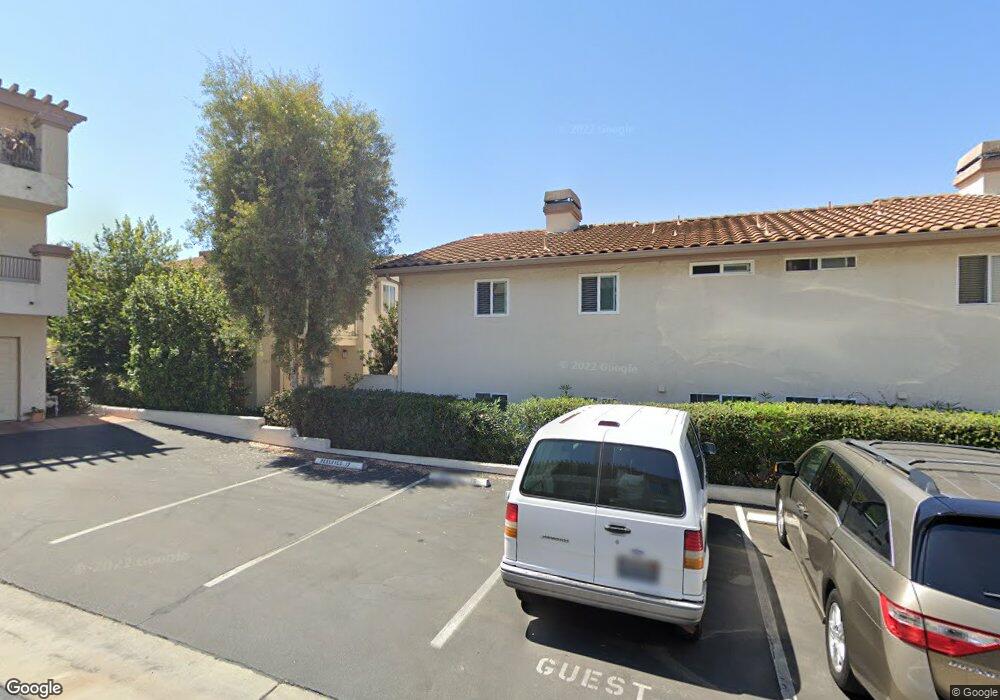
7462 Altiva Place Carlsbad, CA 92009
La Costa NeighborhoodEstimated Value: $655,869 - $703,000
2
Beds
2
Baths
1,032
Sq Ft
$656/Sq Ft
Est. Value
About This Home
This home is located at 7462 Altiva Place, Carlsbad, CA 92009 and is currently estimated at $676,717, approximately $655 per square foot. 7462 Altiva Place is a home located in San Diego County with nearby schools including La Costa Meadows Elementary, San Elijo Middle School, and San Marcos High School.
Ownership History
Date
Name
Owned For
Owner Type
Purchase Details
Closed on
Nov 25, 2002
Sold by
Gelerter Joshua K
Bought by
Gelerter Joshua K and Gelerter Christine M
Current Estimated Value
Home Financials for this Owner
Home Financials are based on the most recent Mortgage that was taken out on this home.
Original Mortgage
$161,500
Outstanding Balance
$65,016
Interest Rate
5.37%
Mortgage Type
Purchase Money Mortgage
Estimated Equity
$611,701
Purchase Details
Closed on
Jul 13, 2001
Sold by
Steen Jennifer L
Bought by
Gelerter Joshua K
Home Financials for this Owner
Home Financials are based on the most recent Mortgage that was taken out on this home.
Original Mortgage
$155,200
Interest Rate
6.37%
Mortgage Type
Purchase Money Mortgage
Purchase Details
Closed on
Jun 18, 1998
Sold by
Poli John A
Bought by
Steen Jennifer L
Home Financials for this Owner
Home Financials are based on the most recent Mortgage that was taken out on this home.
Original Mortgage
$121,200
Interest Rate
7.06%
Mortgage Type
Purchase Money Mortgage
Purchase Details
Closed on
Dec 5, 1989
Create a Home Valuation Report for This Property
The Home Valuation Report is an in-depth analysis detailing your home's value as well as a comparison with similar homes in the area
Home Values in the Area
Average Home Value in this Area
Purchase History
| Date | Buyer | Sale Price | Title Company |
|---|---|---|---|
| Gelerter Joshua K | -- | Equity Title Company | |
| Gelerter Joshua K | $194,000 | Southland Title Co | |
| Steen Jennifer L | $151,500 | Southland Title | |
| -- | $156,900 | -- |
Source: Public Records
Mortgage History
| Date | Status | Borrower | Loan Amount |
|---|---|---|---|
| Open | Gelerter Joshua K | $161,500 | |
| Closed | Gelerter Joshua K | $155,200 | |
| Previous Owner | Steen Jennifer L | $121,200 | |
| Closed | Gelerter Joshua K | $19,400 |
Source: Public Records
Tax History Compared to Growth
Tax History
| Year | Tax Paid | Tax Assessment Tax Assessment Total Assessment is a certain percentage of the fair market value that is determined by local assessors to be the total taxable value of land and additions on the property. | Land | Improvement |
|---|---|---|---|---|
| 2025 | $3,575 | $286,569 | $103,266 | $183,303 |
| 2024 | $3,575 | $280,951 | $101,242 | $179,709 |
| 2023 | $3,456 | $275,443 | $99,257 | $176,186 |
| 2022 | $3,364 | $270,043 | $97,311 | $172,732 |
| 2021 | $3,276 | $264,749 | $95,403 | $169,346 |
| 2020 | $3,219 | $262,035 | $94,425 | $167,610 |
| 2019 | $3,207 | $256,898 | $92,574 | $164,324 |
| 2018 | $3,135 | $251,861 | $90,759 | $161,102 |
| 2017 | $3,081 | $246,924 | $88,980 | $157,944 |
| 2016 | $3,034 | $242,084 | $87,236 | $154,848 |
| 2015 | $2,965 | $238,449 | $85,926 | $152,523 |
| 2014 | $2,876 | $233,779 | $84,243 | $149,536 |
Source: Public Records
Map
Nearby Homes
- 7394 Altiva Place
- 2402 Altisma Way Unit G
- 2412 Altisma Way Unit D
- 2388 Altisma Way Unit 10
- 2364 Altisma Way Unit A
- 2904 Avenida Valera
- 2349 Altisma Way Unit B
- 2647 Marmol Ct
- 2871 Torry Ct
- 2916 Avenida Valera
- 2323 Caringa Way Unit 16
- 7319 Bolero St
- 2508 Navarra Dr Unit 424
- 2506 Navarra Dr Unit 618
- 7373 Alicante Rd Unit 12
- 2544 Navarra Dr Unit 17
- 2319 Caringa Way Unit 58
- 2507 Navarra Dr Unit 202
- 2564 Navarra Dr Unit 213
- 2564 Navarra Dr Unit 115
- 7466 Altiva Place
- 7458 Altiva Place
- 7492 Altiva Place
- 7460 Altiva Place
- 7468 Altiva Place
- 7464 Altiva Place
- 7470 Altiva Place
- 7472 Altiva Place
- 7422 Altiva Place Unit L5A
- 7454 Altiva Place
- 7456 Altiva Place
- 7476 Altiva Place
- 7450 Altiva Place
- 7448 Altiva Place
- 7474 Altiva Place
- 7496 Altiva Place Unit L35A
- 7440 Altiva Place
- 7498 Altiva Place
- 7478 Altiva Place
- 7444 Altiva Place