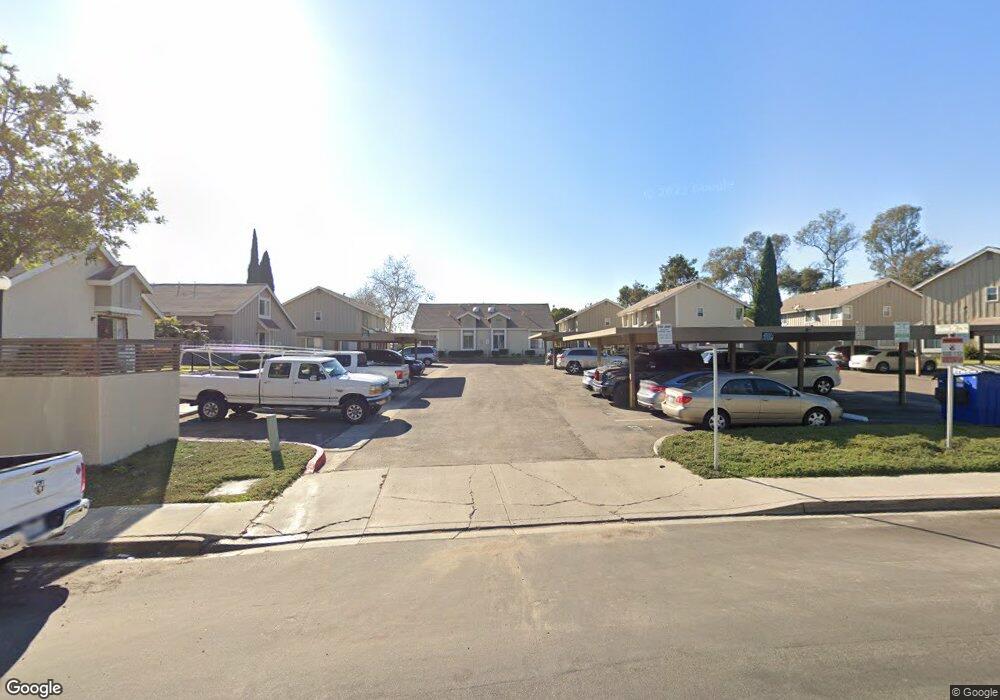
7463 Tooma St Unit B San Diego, CA 92139
Bay Terraces NeighborhoodEstimated Value: $567,334 - $684,000
3
Beds
2
Baths
1,222
Sq Ft
$501/Sq Ft
Est. Value
About This Home
This home is located at 7463 Tooma St Unit B, San Diego, CA 92139 and is currently estimated at $612,084, approximately $500 per square foot. 7463 Tooma St Unit B is a home located in San Diego County with nearby schools including Zamorano Elementary School, Bell Middle School, and Morse High School.
Ownership History
Date
Name
Owned For
Owner Type
Purchase Details
Closed on
Jan 26, 2016
Sold by
Derosa Paula and Macedo Paula
Bought by
Derosa Paula
Current Estimated Value
Home Financials for this Owner
Home Financials are based on the most recent Mortgage that was taken out on this home.
Original Mortgage
$184,900
Outstanding Balance
$147,542
Interest Rate
3.98%
Mortgage Type
New Conventional
Estimated Equity
$464,542
Purchase Details
Closed on
Apr 1, 2003
Sold by
Macedo Paula Rosa
Bought by
Macedo Paula
Home Financials for this Owner
Home Financials are based on the most recent Mortgage that was taken out on this home.
Original Mortgage
$76,000
Interest Rate
6.5%
Mortgage Type
Purchase Money Mortgage
Purchase Details
Closed on
Aug 29, 1994
Sold by
Macedo Paula Rosa
Bought by
Maceda Paula Rosa
Home Financials for this Owner
Home Financials are based on the most recent Mortgage that was taken out on this home.
Original Mortgage
$68,450
Interest Rate
8.65%
Mortgage Type
FHA
Purchase Details
Closed on
Nov 17, 1988
Create a Home Valuation Report for This Property
The Home Valuation Report is an in-depth analysis detailing your home's value as well as a comparison with similar homes in the area
Home Values in the Area
Average Home Value in this Area
Purchase History
| Date | Buyer | Sale Price | Title Company |
|---|---|---|---|
| Derosa Paula | -- | Orange Coast Title | |
| Macedo Paula | -- | Stewart Title | |
| Maceda Paula Rosa | -- | First Southwestern Title Co | |
| -- | $86,400 | -- |
Source: Public Records
Mortgage History
| Date | Status | Borrower | Loan Amount |
|---|---|---|---|
| Open | Derosa Paula | $184,900 | |
| Closed | Macedo Paula | $76,000 | |
| Closed | Maceda Paula Rosa | $68,450 |
Source: Public Records
Tax History Compared to Growth
Tax History
| Year | Tax Paid | Tax Assessment Tax Assessment Total Assessment is a certain percentage of the fair market value that is determined by local assessors to be the total taxable value of land and additions on the property. | Land | Improvement |
|---|---|---|---|---|
| 2025 | $1,898 | $162,091 | $55,916 | $106,175 |
| 2024 | $1,898 | $158,914 | $54,820 | $104,094 |
| 2023 | $1,854 | $155,799 | $53,746 | $102,053 |
| 2022 | $1,803 | $152,745 | $52,693 | $100,052 |
| 2021 | $1,789 | $149,751 | $51,660 | $98,091 |
| 2020 | $1,767 | $148,217 | $51,131 | $97,086 |
| 2019 | $1,734 | $145,312 | $50,129 | $95,183 |
| 2018 | $1,621 | $142,464 | $49,147 | $93,317 |
| 2017 | $1,581 | $139,672 | $48,184 | $91,488 |
| 2016 | $1,554 | $136,935 | $47,240 | $89,695 |
| 2015 | $1,530 | $134,879 | $46,531 | $88,348 |
| 2014 | $1,505 | $132,238 | $45,620 | $86,618 |
Source: Public Records
Map
Nearby Homes
- 7479 Tooma St Unit B
- 7089 Wattle Dr
- 7007 Appian Dr Unit B
- 2920 Briarwood Rd Unit K13
- 2920 Briarwood Rd
- 2920 Briarwood Rd Unit G11
- 6968 Appian Dr
- 3069 Plaza Natalia
- 2588 Pennington Ln
- 3010 Alta View Dr Unit 107
- 2333 Spring Oak Way
- 2329 Grove View Rd
- 1882 Olamar Way
- 6872 Quebec Ct Unit 5
- 6811 Parkside Ave
- 2754 Alta View Dr
- 6795 Parkside Ave
- 6767 Parkside Ave
- 6759 Parkside Ave
- 6755 Parkside Ave
- 2891 Casey St Unit B
- 2891 Casey St Unit A
- 2895 Casey St Unit B
- 2895 Casey St Unit A
- 2879 Casey St Unit B
- 2879 Casey St Unit A
- 2875 Casey St Unit B
- 2875 Casey St Unit A
- 7463 Tooma St Unit A
- 7467 Tooma St Unit B
- 7467 Tooma St Unit A
- 7495 Tooma St Unit A
- 7495 Tooma St Unit B
- 7499 Tooma St Unit B
- 7499 Tooma St Unit A
- 7451 Tooma St Unit B
- 7451 Tooma St Unit A
- 2889 Casey St
- 7471 Tooma St Unit B
- 7479 Tooma St Unit A