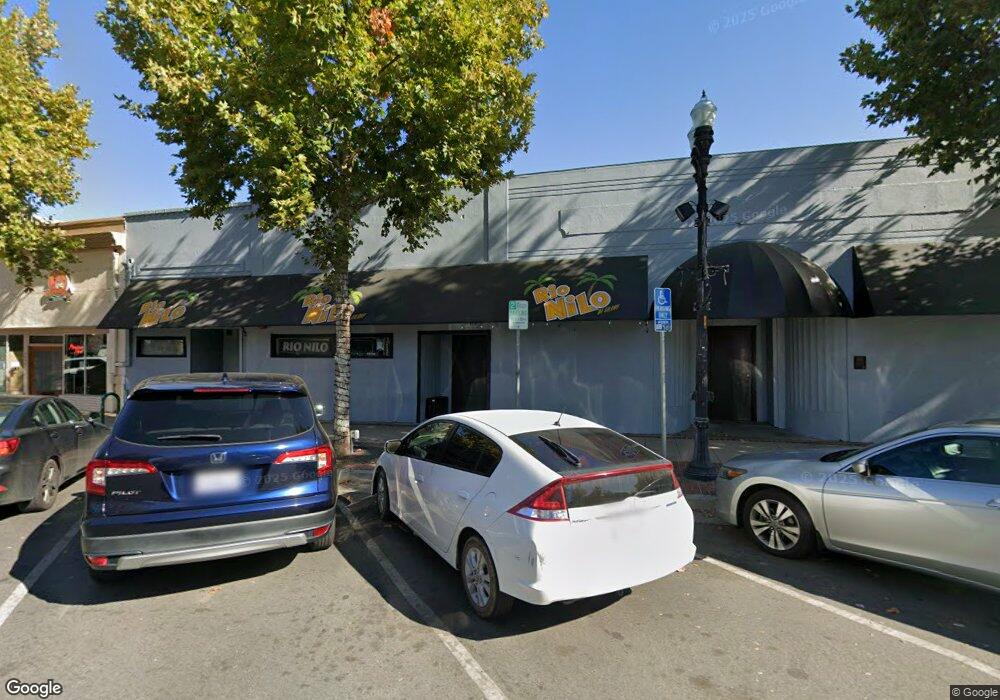
7466 Monterey St Gilroy, CA 95020
Estimated Value: $556,969
Studio
--
Bath
7,980
Sq Ft
$70/Sq Ft
Est. Value
About This Home
This home is located at 7466 Monterey St, Gilroy, CA 95020 and is currently estimated at $556,969, approximately $69 per square foot. 7466 Monterey St is a home located in Santa Clara County with nearby schools including Eliot Elementary School, Brownell Middle School, and Solorsano Middle School.
Ownership History
Date
Name
Owned For
Owner Type
Purchase Details
Closed on
Jan 30, 2014
Sold by
Fragoso Maria Luisa
Bought by
Romo Abigail and Garcia Silvia
Current Estimated Value
Home Financials for this Owner
Home Financials are based on the most recent Mortgage that was taken out on this home.
Original Mortgage
$270,811
Outstanding Balance
$205,519
Interest Rate
4.45%
Mortgage Type
Seller Take Back
Estimated Equity
$351,450
Purchase Details
Closed on
Jan 29, 2014
Sold by
Nunez Sandra
Bought by
Garcia Eduardo
Home Financials for this Owner
Home Financials are based on the most recent Mortgage that was taken out on this home.
Original Mortgage
$270,811
Outstanding Balance
$205,519
Interest Rate
4.45%
Mortgage Type
Seller Take Back
Estimated Equity
$351,450
Purchase Details
Closed on
Jan 27, 2014
Sold by
Romo Abigail
Bought by
Garcia Gustavo
Home Financials for this Owner
Home Financials are based on the most recent Mortgage that was taken out on this home.
Original Mortgage
$270,811
Outstanding Balance
$205,519
Interest Rate
4.45%
Mortgage Type
Seller Take Back
Estimated Equity
$351,450
Create a Home Valuation Report for This Property
The Home Valuation Report is an in-depth analysis detailing your home's value as well as a comparison with similar homes in the area
Home Values in the Area
Average Home Value in this Area
Purchase History
| Date | Buyer | Sale Price | Title Company |
|---|---|---|---|
| Romo Abigail | $271,000 | Old Republic Title Company | |
| Garcia Eduardo | -- | Old Republic Title Company | |
| Garcia Gustavo | -- | Old Republic Title Company |
Source: Public Records
Mortgage History
| Date | Status | Borrower | Loan Amount |
|---|---|---|---|
| Open | Romo Abigail | $270,811 |
Source: Public Records
Tax History
| Year | Tax Paid | Tax Assessment Tax Assessment Total Assessment is a certain percentage of the fair market value that is determined by local assessors to be the total taxable value of land and additions on the property. | Land | Improvement |
|---|---|---|---|---|
| 2025 | $4,256 | $331,967 | $157,824 | $174,143 |
| 2024 | $4,256 | $325,459 | $154,730 | $170,729 |
| 2023 | $4,228 | $319,079 | $151,697 | $167,382 |
| 2022 | $4,154 | $312,823 | $148,723 | $164,100 |
| 2021 | $4,184 | $306,690 | $145,807 | $160,883 |
| 2020 | $4,138 | $303,546 | $144,312 | $159,234 |
| 2019 | $4,102 | $297,595 | $141,483 | $156,112 |
| 2018 | $3,800 | $291,760 | $138,709 | $153,051 |
| 2017 | $3,873 | $286,040 | $135,990 | $150,050 |
| 2016 | $3,790 | $280,432 | $133,324 | $147,108 |
| 2015 | $3,583 | $276,221 | $131,322 | $144,899 |
| 2014 | -- | $637,835 | $168,080 | $469,755 |
Source: Public Records
Map
Nearby Homes
- 0 Monterey Rd
- 7429 Alexander St
- 111 5th St
- 7621 Forest St
- 332 Lewis St Unit 1/2
- 332 Lewis St
- 160 Sarafina Way
- 7711 Monterey St
- 7601 Rosanna St
- 7691 Church St Unit B
- 7681 Hanna St
- 7520 Carmel St
- 7051 Eigleberry St
- 700 Eschenburg Dr
- 7351 Princevalle St Unit Homesite 18
- 7392 Ailes Ct
- 7376 Ailes Ct
- 7344 Ailes Ct
- 7387 Ailes Ct
- 7379 Ailes Ct
- 7484 Monterey Rd
- 7484 Monterey St
- 7450 Monterey St
- 7486 Monterey St
- 0 Dryden Ave
- 0 Monterey Rd Unit ML81035366
- 0 Monterey Rd Unit ML81037685
- 0 Monterey Rd
- 0 Monterey Rd Unit ML81228485
- 0 Monterey Rd Unit ML81335727
- 0 Monterey Rd Unit ML81324453
- 0 Monterey Rd Unit ML81690785
- 7440 Monterey St
- 7430 Monterey St
- 7451 Railroad St
- 7500 Monterey St
- 7453 Monterey St
- 7461 Monterey St
- 7451 Monterey St
- 7483 Monterey St
Your Personal Tour Guide
Ask me questions while you tour the home.