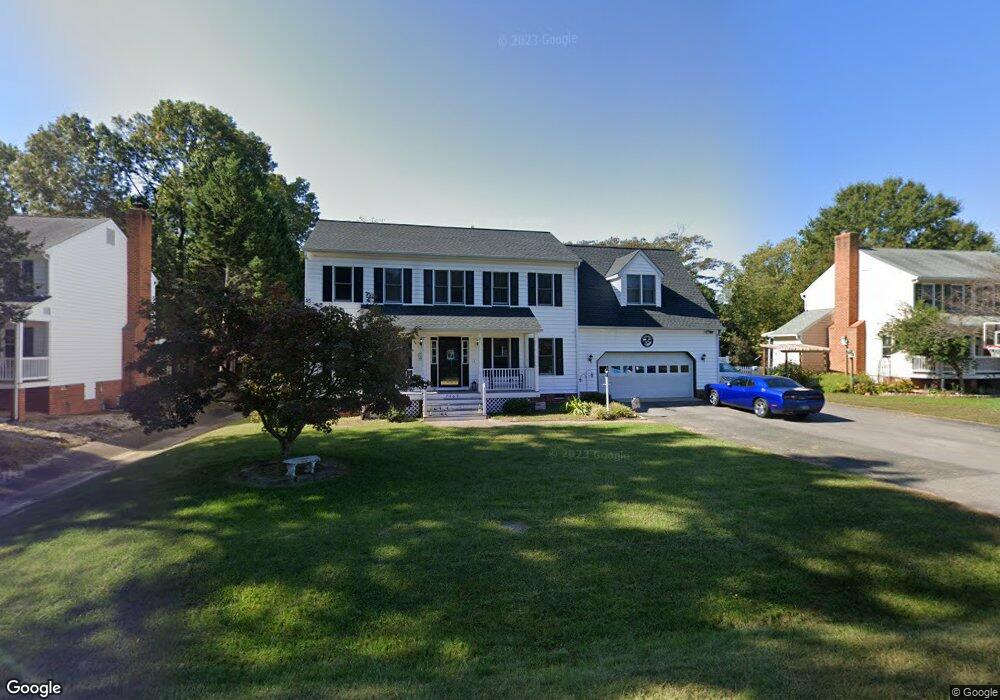
7469 Lake Terrell Dr Mechanicsville, VA 23111
Estimated Value: $497,000 - $542,000
5
Beds
4
Baths
2,754
Sq Ft
$186/Sq Ft
Est. Value
About This Home
This home is located at 7469 Lake Terrell Dr, Mechanicsville, VA 23111 and is currently estimated at $513,463, approximately $186 per square foot. 7469 Lake Terrell Dr is a home located in Hanover County with nearby schools including Washington-Henry Elementary School, Chickahominy Middle School, and Atlee High School.
Ownership History
Date
Name
Owned For
Owner Type
Purchase Details
Closed on
Aug 29, 2022
Sold by
James Richard W and James Rhonda S
Bought by
James Christopher L and James Tiffanie R
Current Estimated Value
Home Financials for this Owner
Home Financials are based on the most recent Mortgage that was taken out on this home.
Original Mortgage
$253,500
Outstanding Balance
$241,186
Interest Rate
4.75%
Mortgage Type
VA
Estimated Equity
$272,277
Purchase Details
Closed on
May 28, 2021
Sold by
James Richard W and James Rhonda S
Bought by
James Richard W and James Rhonda S
Purchase Details
Closed on
Aug 15, 2019
Sold by
James Richard W and James Rhonda S
Bought by
James Richard W and James Rhonda S
Purchase Details
Closed on
Jan 22, 1999
Sold by
Wessel James
Bought by
James Richard
Home Financials for this Owner
Home Financials are based on the most recent Mortgage that was taken out on this home.
Original Mortgage
$139,400
Interest Rate
6.74%
Create a Home Valuation Report for This Property
The Home Valuation Report is an in-depth analysis detailing your home's value as well as a comparison with similar homes in the area
Home Values in the Area
Average Home Value in this Area
Purchase History
| Date | Buyer | Sale Price | Title Company |
|---|---|---|---|
| James Christopher L | -- | -- | |
| James Richard W | -- | None Available | |
| James Richard W | -- | None Available | |
| James Richard | $164,000 | -- |
Source: Public Records
Mortgage History
| Date | Status | Borrower | Loan Amount |
|---|---|---|---|
| Open | James Christopher L | $253,500 | |
| Previous Owner | James Richard | $139,400 |
Source: Public Records
Tax History Compared to Growth
Tax History
| Year | Tax Paid | Tax Assessment Tax Assessment Total Assessment is a certain percentage of the fair market value that is determined by local assessors to be the total taxable value of land and additions on the property. | Land | Improvement |
|---|---|---|---|---|
| 2025 | $3,620 | $446,900 | $83,500 | $363,400 |
| 2024 | $3,515 | $434,000 | $78,500 | $355,500 |
| 2023 | $3,105 | $403,300 | $73,500 | $329,800 |
| 2022 | $2,894 | $357,300 | $68,500 | $288,800 |
| 2021 | $2,580 | $318,500 | $63,500 | $255,000 |
| 2020 | $2,462 | $304,000 | $58,500 | $245,500 |
| 2019 | $2,347 | $304,000 | $58,500 | $245,500 |
| 2018 | $2,347 | $289,700 | $58,500 | $231,200 |
| 2017 | $2,180 | $269,100 | $58,000 | $211,100 |
| 2016 | $2,180 | $269,100 | $58,000 | $211,100 |
| 2015 | $2,023 | $249,800 | $55,000 | $194,800 |
| 2014 | $2,023 | $249,800 | $55,000 | $194,800 |
Source: Public Records
Map
Nearby Homes
- 7540 Tangle Ridge Dr
- 8043 Atlee Rd
- 8033 Ellerson Wood Dr
- 8259 Franklin Ln
- 8096 Saddle Crest Dr
- 8236 Meadowview Ln
- 7365 Sunshine Ct
- 7367 Pickett Ave
- 8382 Timberlake Green Dr
- 7358 Hill View Dr
- 7770 Secret Knoll Terrace
- 7754 Secret Knoll Terrace
- 7762 Secret Knoll Terrace
- 7766 Secret Knoll Terrace
- 7758 Secret Knoll Terrace
- 7774 Secret Knoll Terrace
- 8183 Burnside Ct
- 7786 Secret Knoll Terrace
- 8179 Holly Ln
- 8294 Burnside Dr
- 8220 Meadowlake Rd
- 7473 Lake Terrell Dr
- 7468 Lake Terrell Dr
- 7464 Lake Terrell Dr
- 8219 Meadowlake Rd
- 8243 Lucille Rd
- 8226 Meadowlake Rd
- 7472 Lake Terrell Dr
- 8238 Lucille Rd
- 8234 Lucille Rd
- 8242 Lucille Rd
- 8230 Lucille Rd
- 7451 Lake Terrell Dr
- 7454 Lake Terrell Dr
- 8229 Meadowlake Rd
- 8227 Meadowlake Rd
- 7489 Eleanor Dr
- 8226 Lucille Rd
- 8221 Lucille Rd
- 7481 Eleanor Dr