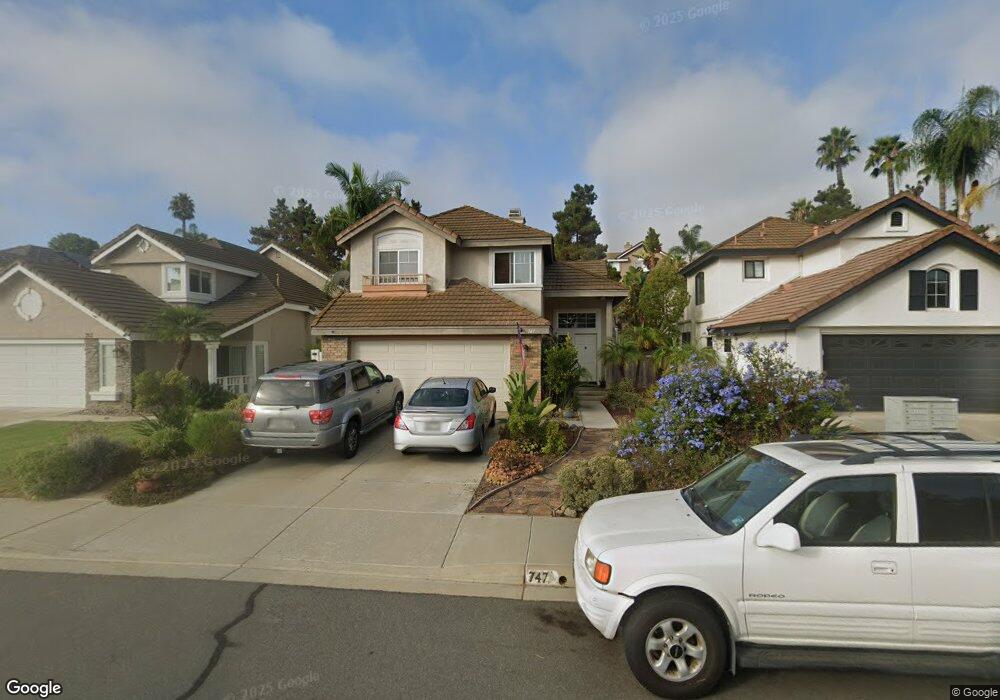
747 Lupine Dr Unit 5 San Marcos, CA 92078
Barham Discovery Community NeighborhoodEstimated Value: $1,018,000 - $1,088,000
4
Beds
3
Baths
1,746
Sq Ft
$607/Sq Ft
Est. Value
About This Home
This home is located at 747 Lupine Dr Unit 5, San Marcos, CA 92078 and is currently estimated at $1,059,413, approximately $606 per square foot. 747 Lupine Dr Unit 5 is a home located in San Diego County with nearby schools including Discovery Elementary School, San Elijo Middle School, and San Marcos High School.
Ownership History
Date
Name
Owned For
Owner Type
Purchase Details
Closed on
Oct 7, 2021
Sold by
Stark Hayden S and Stark Leslie A
Bought by
Stark Revocable Living Trust and Stark
Current Estimated Value
Purchase Details
Closed on
Feb 7, 1996
Sold by
Presley Homes
Bought by
Stark Hayden S and Stark Leslie A
Home Financials for this Owner
Home Financials are based on the most recent Mortgage that was taken out on this home.
Original Mortgage
$174,579
Interest Rate
7%
Create a Home Valuation Report for This Property
The Home Valuation Report is an in-depth analysis detailing your home's value as well as a comparison with similar homes in the area
Home Values in the Area
Average Home Value in this Area
Purchase History
| Date | Buyer | Sale Price | Title Company |
|---|---|---|---|
| Stark Revocable Living Trust | -- | None Listed On Document | |
| Stark Hayden S | $184,000 | First American Title |
Source: Public Records
Mortgage History
| Date | Status | Borrower | Loan Amount |
|---|---|---|---|
| Previous Owner | Stark Hayden S | $174,579 |
Source: Public Records
Tax History Compared to Growth
Tax History
| Year | Tax Paid | Tax Assessment Tax Assessment Total Assessment is a certain percentage of the fair market value that is determined by local assessors to be the total taxable value of land and additions on the property. | Land | Improvement |
|---|---|---|---|---|
| 2025 | $4,176 | $344,259 | $83,046 | $261,213 |
| 2024 | $4,176 | $337,510 | $81,418 | $256,092 |
| 2023 | $4,102 | $330,893 | $79,822 | $251,071 |
| 2022 | $4,046 | $324,406 | $78,257 | $246,149 |
| 2021 | $3,982 | $318,046 | $76,723 | $241,323 |
| 2020 | $3,943 | $314,786 | $75,937 | $238,849 |
| 2019 | $3,863 | $308,615 | $74,449 | $234,166 |
| 2018 | $3,748 | $302,565 | $72,990 | $229,575 |
| 2017 | $3,676 | $296,633 | $71,559 | $225,074 |
| 2016 | $3,621 | $290,817 | $70,156 | $220,661 |
| 2015 | $4,156 | $286,450 | $69,103 | $217,347 |
| 2014 | $4,069 | $280,840 | $67,750 | $213,090 |
Source: Public Records
Map
Nearby Homes
- 757 Marigold Way
- 797 Trailside Place
- 318 Metric Rd
- 1219 Sunrise View Unit 104
- 1210 Sunrise View Unit 102
- 380 Avenida la Cuesta
- 507 Spindle Way
- 550 Echo Ln
- 653 Fahrenheit Rd
- 1234 Sunrise View Unit 101
- 1027 Cima Dr
- 450 Caliper Way
- 501 Gadget Way
- Plan 3 at The Hill District - Peak59
- Plan 1 at The Hill District - Peak59
- Plan 4 at The Hill District - Peak59
- Plan 2 at The Hill District - Peak59
- Radius 4 Plan at The Hill District - Radius
- Element 2 Plan at The Hill District - Element
- Radius 3 Plan at The Hill District - Radius
- 753 Lupine Dr Unit 5
- 741 Lupine Dr
- 755 Lupine Dr
- 737 Lupine Dr Unit 5
- 680 Shenandoah Ave Unit 5
- 678 Shenandoah Ave
- 733 Lupine Dr Unit 5
- 759 Lupine Dr Unit 5
- 682 Shenandoah Ave Unit 5
- 684 Shenandoah Ave
- 674 Shenandoah Ave Unit 5
- 731 Lupine Dr
- 748 Lupine Dr
- 742 Lupine Dr Unit 5
- 686 Shenandoah Ave
- 752 Lupine Dr
- 672 Shenandoah Ave
- 738 Lupine Dr
- 761 Lupine Dr
- 688 Shenandoah Ave