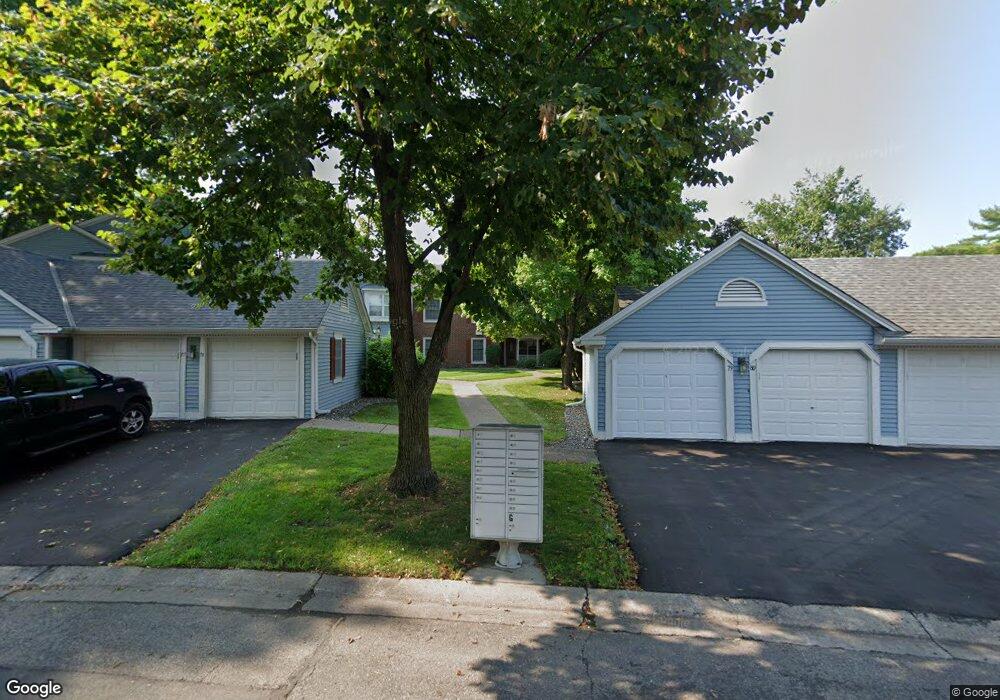
7479 W 110th St Bloomington, MN 55438
West Bloomington NeighborhoodEstimated Value: $202,319 - $213,000
2
Beds
1
Bath
960
Sq Ft
$216/Sq Ft
Est. Value
About This Home
This home is located at 7479 W 110th St, Bloomington, MN 55438 and is currently estimated at $207,330, approximately $215 per square foot. 7479 W 110th St is a home located in Hennepin County with nearby schools including Olson Elementary School, Olson Middle School, and Jefferson Senior High School.
Ownership History
Date
Name
Owned For
Owner Type
Purchase Details
Closed on
Oct 9, 2020
Sold by
Foster Gina
Bought by
Kirscht Glenna and Kirscht Jennifer
Current Estimated Value
Home Financials for this Owner
Home Financials are based on the most recent Mortgage that was taken out on this home.
Original Mortgage
$171,095
Outstanding Balance
$152,180
Interest Rate
2.9%
Mortgage Type
New Conventional
Estimated Equity
$55,150
Purchase Details
Closed on
Jul 19, 2017
Sold by
The Entrust Group Inc
Bought by
Foster Gina
Home Financials for this Owner
Home Financials are based on the most recent Mortgage that was taken out on this home.
Original Mortgage
$133,450
Interest Rate
3.6%
Mortgage Type
New Conventional
Purchase Details
Closed on
Nov 19, 2015
Sold by
Knights Brenna N
Bought by
The Entrust Group Inc and Kathryn L Williams Ira #7230013768
Purchase Details
Closed on
Aug 31, 2009
Sold by
King Andrea M
Bought by
Knights Brenna N
Purchase Details
Closed on
Jul 21, 2006
Sold by
Jacobsen Faye M
Bought by
King Andrea M
Create a Home Valuation Report for This Property
The Home Valuation Report is an in-depth analysis detailing your home's value as well as a comparison with similar homes in the area
Home Values in the Area
Average Home Value in this Area
Purchase History
| Date | Buyer | Sale Price | Title Company |
|---|---|---|---|
| Kirscht Glenna | $180,100 | Trademark Title Services Inc | |
| Foster Gina | $157,000 | Trademark Title Services Inc | |
| The Entrust Group Inc | $108,500 | Burnet Title | |
| Knights Brenna N | $124,900 | -- | |
| King Andrea M | $150,000 | -- | |
| Kirscht Glenna Glenna | $180,100 | -- |
Source: Public Records
Mortgage History
| Date | Status | Borrower | Loan Amount |
|---|---|---|---|
| Open | Kirscht Glenna | $171,095 | |
| Previous Owner | Foster Gina | $133,450 | |
| Closed | Kirscht Glenna Glenna | $171,095 |
Source: Public Records
Tax History Compared to Growth
Tax History
| Year | Tax Paid | Tax Assessment Tax Assessment Total Assessment is a certain percentage of the fair market value that is determined by local assessors to be the total taxable value of land and additions on the property. | Land | Improvement |
|---|---|---|---|---|
| 2024 | $2,374 | $183,200 | $62,900 | $120,300 |
| 2023 | $2,234 | $185,700 | $62,900 | $122,800 |
| 2022 | $2,090 | $175,700 | $62,900 | $112,800 |
| 2021 | $1,734 | $163,200 | $58,800 | $104,400 |
| 2020 | $1,667 | $156,500 | $57,100 | $99,400 |
| 2019 | $1,670 | $148,100 | $58,700 | $89,400 |
| 2018 | $1,528 | $125,600 | $59,100 | $66,500 |
| 2017 | $1,529 | $112,600 | $49,200 | $63,400 |
| 2016 | $1,157 | $105,000 | $45,500 | $59,500 |
| 2015 | $837 | $82,100 | $43,700 | $38,400 |
| 2014 | -- | $80,500 | $42,400 | $38,100 |
Source: Public Records
Map
Nearby Homes
- 7525 W 110th St Unit 7
- 7471 W 110th St
- 7518 W 110th St
- 10907 Rhode Island Ave S
- 11036 Quebec Cir
- 11048 Quebec Cir
- 11159 Sumter Ave S
- 11058 Oregon Curve
- 10935 Oregon Ave S
- 11015 Oregon Curve
- 11275 Oregon Cir
- 7321 Woodstock Curve
- 8022 W 111th St Unit 8022
- 7500 Landau Dr
- 11200 Wyoming Rd S
- 11073 Oregon Cir Unit 69
- 7256 Woodstock Dr
- 7616 Landau Dr
- 7401 Landau Dr Unit 12
- 10707 Yukon Ave S
- 7481 W 110th St
- 7477 W 110th St
- 7473 W 110th St Unit 14
- 7473 W 110th St
- 7467 W 110th St
- 7469 W 110th St
- 7459 W 110th St
- 7465 W 110th St
- 7463 W 110th St
- 7461 W 110th St
- 7526 W 111th St
- 7451 W 110th St Unit 1
- 7453 W 110th St Unit 9
- 7457 W 110th St
- 7455 W 110th St Unit 2
- 7524 W 111th St
- 7536 W 111th St
- 7517 W 110th St Unit 5
- 7523 W 110th St
- 7511 W 110th St