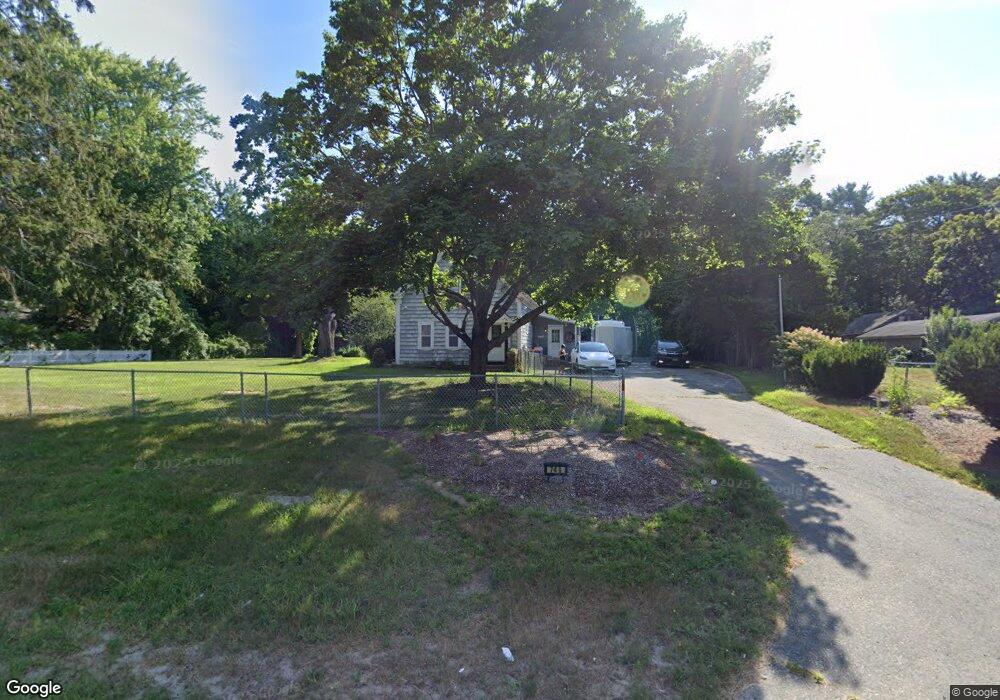
748 County Rd West Wareham, MA 02576
Estimated Value: $459,000 - $516,000
4
Beds
1
Bath
1,442
Sq Ft
$339/Sq Ft
Est. Value
About This Home
This home is located at 748 County Rd, West Wareham, MA 02576 and is currently estimated at $488,406, approximately $338 per square foot. 748 County Rd is a home located in Plymouth County.
Ownership History
Date
Name
Owned For
Owner Type
Purchase Details
Closed on
Jan 13, 2022
Sold by
Elizabeth L Bessey Ret and Bessey
Bought by
Bessey Adam R and Murphy Mari
Current Estimated Value
Home Financials for this Owner
Home Financials are based on the most recent Mortgage that was taken out on this home.
Original Mortgage
$250,000
Outstanding Balance
$229,272
Interest Rate
3.05%
Mortgage Type
Purchase Money Mortgage
Estimated Equity
$259,134
Create a Home Valuation Report for This Property
The Home Valuation Report is an in-depth analysis detailing your home's value as well as a comparison with similar homes in the area
Home Values in the Area
Average Home Value in this Area
Purchase History
| Date | Buyer | Sale Price | Title Company |
|---|---|---|---|
| Bessey Adam R | $312,500 | None Available | |
| Bessey Adam R | $312,500 | None Available |
Source: Public Records
Mortgage History
| Date | Status | Borrower | Loan Amount |
|---|---|---|---|
| Open | Bessey Adam R | $250,000 | |
| Closed | Bessey Adam R | $250,000 |
Source: Public Records
Tax History
| Year | Tax Paid | Tax Assessment Tax Assessment Total Assessment is a certain percentage of the fair market value that is determined by local assessors to be the total taxable value of land and additions on the property. | Land | Improvement |
|---|---|---|---|---|
| 2025 | $4,295 | $412,200 | $115,300 | $296,900 |
| 2024 | $4,235 | $377,100 | $92,400 | $284,700 |
| 2023 | $3,830 | $344,900 | $84,100 | $260,800 |
| 2022 | $3,830 | $290,600 | $83,300 | $207,300 |
| 2021 | $3,549 | $263,900 | $83,300 | $180,600 |
| 2020 | $3,405 | $256,800 | $83,300 | $173,500 |
| 2019 | $3,186 | $239,700 | $86,000 | $153,700 |
| 2018 | $2,974 | $218,200 | $86,000 | $132,200 |
| 2017 | $2,935 | $218,200 | $86,000 | $132,200 |
| 2016 | $2,787 | $206,000 | $87,100 | $118,900 |
| 2015 | $2,656 | $203,200 | $87,100 | $116,100 |
| 2014 | $2,673 | $208,000 | $87,100 | $120,900 |
Source: Public Records
Map
Nearby Homes
Your Personal Tour Guide
Ask me questions while you tour the home.