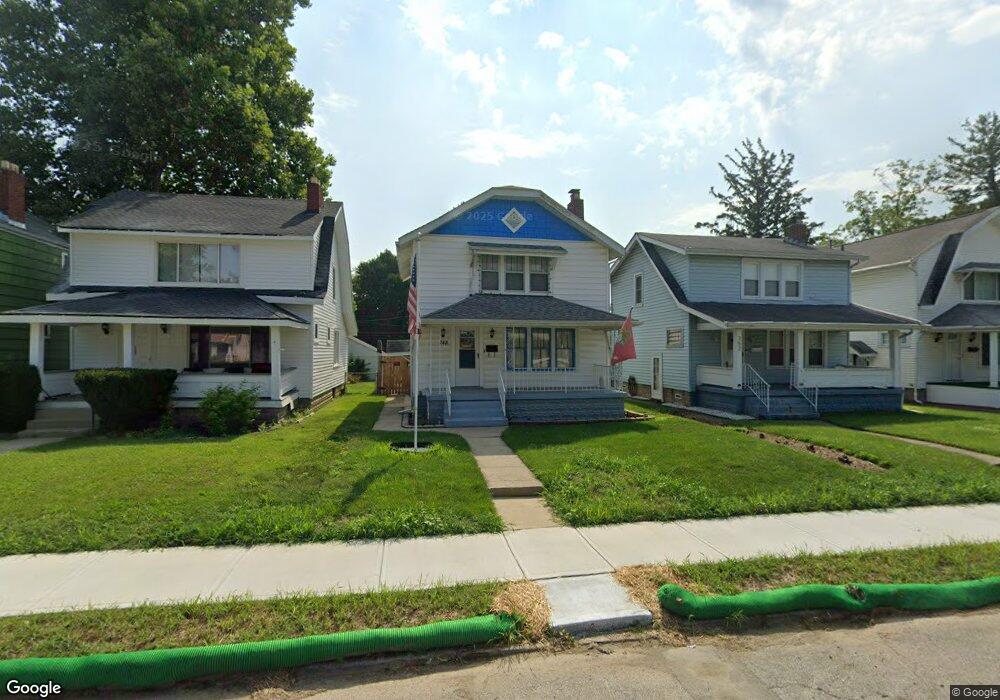
748 S Richardson Ave Columbus, OH 43204
South Central Hilltop NeighborhoodEstimated Value: $128,408 - $148,000
2
Beds
1
Bath
1,056
Sq Ft
$131/Sq Ft
Est. Value
About This Home
This home is located at 748 S Richardson Ave, Columbus, OH 43204 and is currently estimated at $138,852, approximately $131 per square foot. 748 S Richardson Ave is a home located in Franklin County with nearby schools including Lindbergh Elementary School, Hilltonia Middle School, and Briggs High School.
Ownership History
Date
Name
Owned For
Owner Type
Purchase Details
Closed on
Apr 27, 2006
Sold by
Mandly Tasha and Mandly Philip
Bought by
Miller Susan
Current Estimated Value
Home Financials for this Owner
Home Financials are based on the most recent Mortgage that was taken out on this home.
Original Mortgage
$68,300
Interest Rate
9.95%
Mortgage Type
Fannie Mae Freddie Mac
Purchase Details
Closed on
May 30, 2000
Sold by
Dillbeck Deborah A Gibson
Bought by
Mandly Tasha and Mandly Philip
Home Financials for this Owner
Home Financials are based on the most recent Mortgage that was taken out on this home.
Original Mortgage
$63,957
Interest Rate
8.55%
Mortgage Type
FHA
Purchase Details
Closed on
Oct 26, 1995
Sold by
Est James A Gabriel
Bought by
Deborah A Gibson and Deborah Dillbeck
Home Financials for this Owner
Home Financials are based on the most recent Mortgage that was taken out on this home.
Original Mortgage
$52,863
Interest Rate
7.65%
Mortgage Type
FHA
Create a Home Valuation Report for This Property
The Home Valuation Report is an in-depth analysis detailing your home's value as well as a comparison with similar homes in the area
Home Values in the Area
Average Home Value in this Area
Purchase History
| Date | Buyer | Sale Price | Title Company |
|---|---|---|---|
| Miller Susan | $68,300 | None Available | |
| Mandly Tasha | $64,500 | Title First Agency Inc | |
| Deborah A Gibson | $53,900 | -- |
Source: Public Records
Mortgage History
| Date | Status | Borrower | Loan Amount |
|---|---|---|---|
| Previous Owner | Miller Susan | $68,300 | |
| Previous Owner | Mandly Tasha | $63,957 | |
| Previous Owner | Deborah A Gibson | $52,863 |
Source: Public Records
Tax History Compared to Growth
Tax History
| Year | Tax Paid | Tax Assessment Tax Assessment Total Assessment is a certain percentage of the fair market value that is determined by local assessors to be the total taxable value of land and additions on the property. | Land | Improvement |
|---|---|---|---|---|
| 2024 | $1,625 | $36,200 | $4,520 | $31,680 |
| 2023 | $1,705 | $36,190 | $4,515 | $31,675 |
| 2022 | $1,161 | $19,680 | $2,000 | $17,680 |
| 2021 | $1,346 | $19,680 | $2,000 | $17,680 |
| 2020 | $1,109 | $19,680 | $2,000 | $17,680 |
| 2019 | $1,000 | $16,490 | $1,680 | $14,810 |
| 2018 | $1,000 | $16,490 | $1,680 | $14,810 |
| 2017 | $1,052 | $16,490 | $1,680 | $14,810 |
| 2016 | $1,104 | $16,670 | $3,750 | $12,920 |
| 2015 | $1,002 | $16,670 | $3,750 | $12,920 |
| 2014 | $1,005 | $16,670 | $3,750 | $12,920 |
| 2013 | $583 | $19,600 | $4,410 | $15,190 |
Source: Public Records
Map
Nearby Homes
- 734 S Richardson Ave
- 727 S Richardson Ave
- 730 S Burgess Ave
- 811 S Richardson Ave
- 651 S Terrace Ave
- 724 S Eureka Ave
- 2585 Eakin Rd
- 2579 Eakin Rd
- 815 S Wayne Ave
- 693 S Wayne Ave
- 2538 Vanderberg Ave
- 2530 Vanderberg Ave
- 678 S Warren Ave
- 599 S Burgess Ave Unit 601
- 2687 Vanderberg Ave
- 677 S Warren Ave
- 620 S Warren Ave
- 805 S Warren Ave
- 2491 Vanderberg Ave
- 614 S Warren Ave
- 752 S Richardson Ave
- 740 S Richardson Ave
- 756 S Richardson Ave
- 762 S Richardson Ave
- 766 S Richardson Ave
- 730 S Richardson Ave
- 770 S Richardson Ave
- 726 S Richardson Ave
- 759 S Terrace Ave
- 765 S Terrace Ave
- 755 S Terrace Ave
- 769 S Terrace Ave
- 749 S Terrace Ave
- 774 S Richardson Ave
- 745 S Richardson Ave
- 749 S Richardson Ave
- 775 S Terrace Ave
- 741 S Richardson Ave
- 755 S Richardson Ave
- 743 S Terrace Ave Unit 745