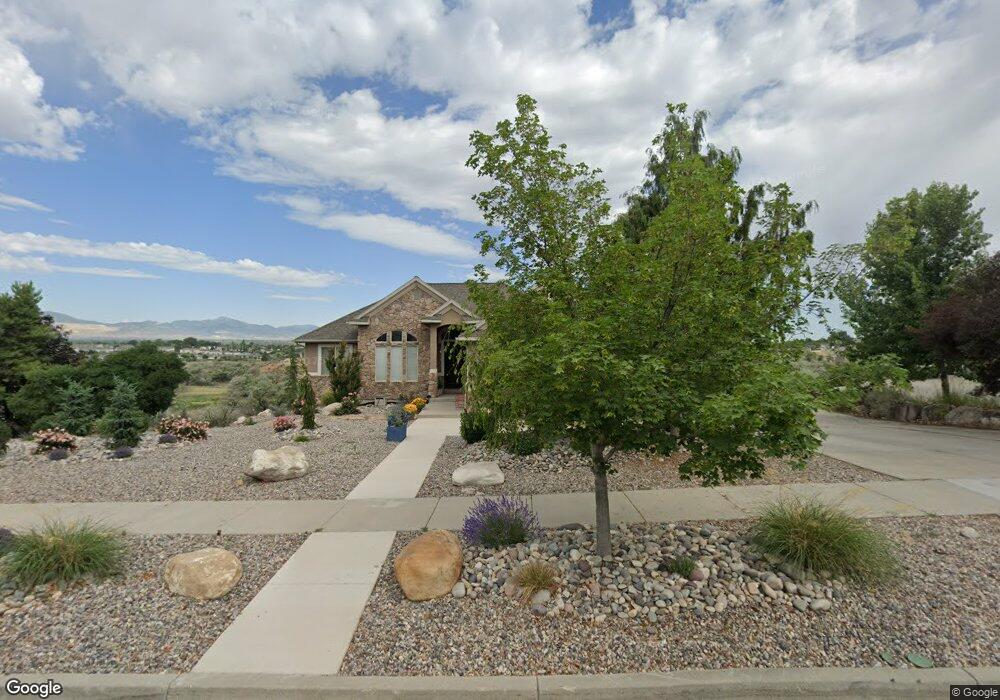
748 W Webb Rd Draper, UT 84020
Estimated Value: $1,136,000 - $1,545,000
5
Beds
3
Baths
3,756
Sq Ft
$344/Sq Ft
Est. Value
About This Home
This home is located at 748 W Webb Rd, Draper, UT 84020 and is currently estimated at $1,292,718, approximately $344 per square foot. 748 W Webb Rd is a home located in Salt Lake County with nearby schools including Draper Park Middle School, American Preparatory Academy - Draper 2 Campus, and Dancing Moose Montessori School - South Jordan.
Ownership History
Date
Name
Owned For
Owner Type
Purchase Details
Closed on
May 28, 2025
Sold by
Hall Cody C and Hall Diana L
Bought by
Hall Family Living Trust and Hall
Current Estimated Value
Purchase Details
Closed on
Sep 8, 2006
Sold by
Countrywide Home Loans Inc
Bought by
Hall Cody C and Hall Diana L
Home Financials for this Owner
Home Financials are based on the most recent Mortgage that was taken out on this home.
Original Mortgage
$224,900
Interest Rate
6.56%
Mortgage Type
Purchase Money Mortgage
Purchase Details
Closed on
May 25, 2006
Sold by
Demarchi Daniel E
Bought by
Countrywide Home Loans Inc
Purchase Details
Closed on
Sep 17, 2003
Sold by
Neilson R Todd
Bought by
Demarchi Daniel E
Home Financials for this Owner
Home Financials are based on the most recent Mortgage that was taken out on this home.
Original Mortgage
$292,000
Interest Rate
6.3%
Mortgage Type
Purchase Money Mortgage
Create a Home Valuation Report for This Property
The Home Valuation Report is an in-depth analysis detailing your home's value as well as a comparison with similar homes in the area
Home Values in the Area
Average Home Value in this Area
Purchase History
| Date | Buyer | Sale Price | Title Company |
|---|---|---|---|
| Hall Family Living Trust | -- | None Listed On Document | |
| Hall Cody C | -- | First American Title | |
| Countrywide Home Loans Inc | $317,351 | Accommodation | |
| Demarchi Daniel E | -- | First American Title |
Source: Public Records
Mortgage History
| Date | Status | Borrower | Loan Amount |
|---|---|---|---|
| Previous Owner | Hall Cody C | $224,900 | |
| Previous Owner | Demarchi Daniel E | $292,000 |
Source: Public Records
Tax History
| Year | Tax Paid | Tax Assessment Tax Assessment Total Assessment is a certain percentage of the fair market value that is determined by local assessors to be the total taxable value of land and additions on the property. | Land | Improvement |
|---|---|---|---|---|
| 2025 | $5,871 | $1,092,300 | $330,600 | $761,700 |
| 2024 | $5,871 | $1,121,500 | $324,500 | $797,000 |
| 2023 | $5,871 | $1,077,900 | $321,300 | $756,600 |
| 2022 | $5,650 | $1,034,900 | $315,000 | $719,900 |
| 2021 | $5,051 | $790,200 | $236,300 | $553,900 |
| 2020 | $4,594 | $681,300 | $214,800 | $466,500 |
| 2019 | $3,880 | $562,300 | $202,600 | $359,700 |
| 2018 | $3,554 | $526,400 | $202,600 | $323,800 |
| 2017 | $3,424 | $485,800 | $202,600 | $283,200 |
| 2016 | $3,311 | $456,500 | $202,600 | $253,900 |
| 2015 | $3,922 | $490,800 | $206,500 | $284,300 |
| 2014 | $3,726 | $464,700 | $196,800 | $267,900 |
Source: Public Records
Map
Nearby Homes
- 722 W Webb Rd
- 587 W Cephus Rd
- 12152 735 W
- 12214 S Pixie Dr
- 12235 S Ryder Ct
- 12231 S Ryder Ct
- 12514 Tithing Point Dr
- 552 Sunset Crest Way
- 11979 Draper Ridge Dr
- 1259 W Moon Way Unit 134
- 1273 W Hendrix St Unit 145
- 12091 S Lampton View Dr
- 12252 Margaret Rose Dr
- 1043 W 13200 S
- 401 W Election Rd
- 264 W 13165 S
- 1359 W Stewart Falls Dr
- 12896 S 1300 W
- 12021 Misty Sea Rd
- 11781 S Halls Creek Rd
Your Personal Tour Guide
Ask me questions while you tour the home.