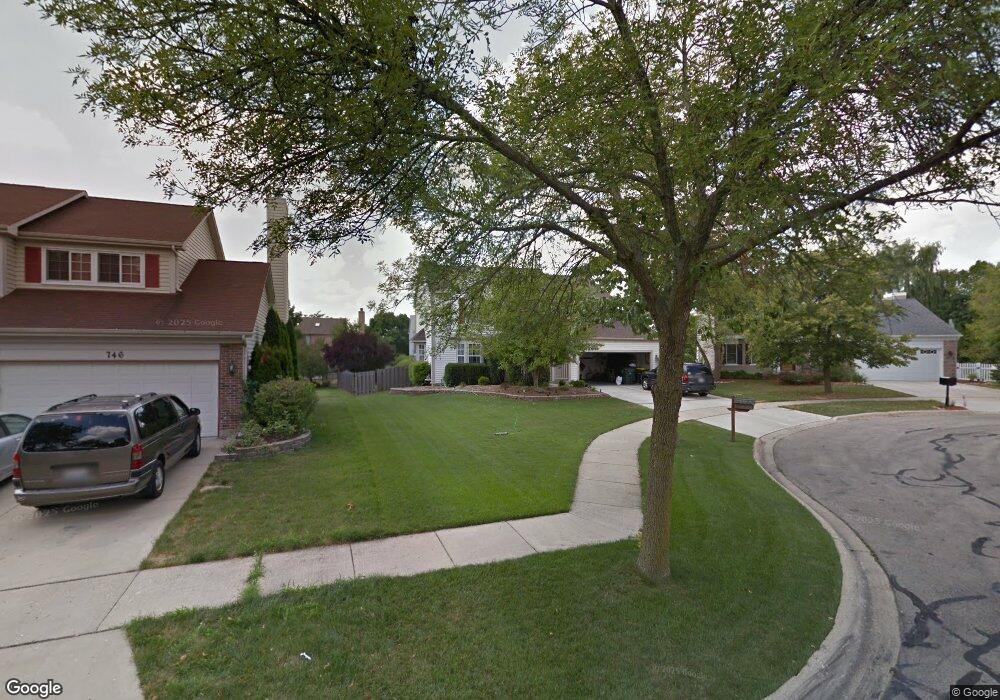
748 Warwick Ct Carol Stream, IL 60188
Estimated Value: $541,630 - $571,000
4
Beds
4
Baths
2,459
Sq Ft
$226/Sq Ft
Est. Value
About This Home
This home is located at 748 Warwick Ct, Carol Stream, IL 60188 and is currently estimated at $554,908, approximately $225 per square foot. 748 Warwick Ct is a home located in DuPage County with nearby schools including Cloverdale Elementary School, Jay Stream Middle School, and Glenbard North High School.
Ownership History
Date
Name
Owned For
Owner Type
Purchase Details
Closed on
Aug 27, 2015
Sold by
Mulshine Brian W and Mulshine Jacquelyn A
Bought by
Marshall Gregory T and Marshall Amanda A
Current Estimated Value
Home Financials for this Owner
Home Financials are based on the most recent Mortgage that was taken out on this home.
Original Mortgage
$292,000
Outstanding Balance
$231,974
Interest Rate
4.25%
Mortgage Type
New Conventional
Estimated Equity
$322,934
Purchase Details
Closed on
Apr 30, 1998
Sold by
Jancik Dewey T and Jancik Laura L
Bought by
Mulshine Brian W and Mulshine Jacquelyn A
Home Financials for this Owner
Home Financials are based on the most recent Mortgage that was taken out on this home.
Original Mortgage
$187,000
Interest Rate
7.27%
Create a Home Valuation Report for This Property
The Home Valuation Report is an in-depth analysis detailing your home's value as well as a comparison with similar homes in the area
Home Values in the Area
Average Home Value in this Area
Purchase History
| Date | Buyer | Sale Price | Title Company |
|---|---|---|---|
| Marshall Gregory T | $365,000 | Near North National Title | |
| Mulshine Brian W | $235,000 | Chicago Title Insurance Co |
Source: Public Records
Mortgage History
| Date | Status | Borrower | Loan Amount |
|---|---|---|---|
| Open | Marshall Gregory T | $292,000 | |
| Previous Owner | Mulshine Brian W | $187,000 |
Source: Public Records
Tax History Compared to Growth
Tax History
| Year | Tax Paid | Tax Assessment Tax Assessment Total Assessment is a certain percentage of the fair market value that is determined by local assessors to be the total taxable value of land and additions on the property. | Land | Improvement |
|---|---|---|---|---|
| 2024 | $12,196 | $150,208 | $38,522 | $111,686 |
| 2023 | $11,467 | $136,280 | $34,950 | $101,330 |
| 2022 | $10,485 | $119,640 | $32,480 | $87,160 |
| 2021 | $9,994 | $113,570 | $30,830 | $82,740 |
| 2020 | $9,781 | $110,170 | $29,910 | $80,260 |
| 2019 | $9,423 | $106,240 | $28,840 | $77,400 |
| 2018 | $9,367 | $107,020 | $29,050 | $77,970 |
| 2017 | $9,754 | $108,690 | $29,050 | $79,640 |
| 2016 | $9,579 | $103,820 | $27,750 | $76,070 |
| 2015 | $9,514 | $98,280 | $26,270 | $72,010 |
| 2014 | $9,064 | $92,440 | $25,600 | $66,840 |
| 2013 | $9,009 | $94,650 | $26,210 | $68,440 |
Source: Public Records
Map
Nearby Homes
- 1083 Country Glen Ln
- 615 Kingsbridge Dr
- 489 Canterbury Dr Unit 15E
- 768 Provincetown Dr Unit 16
- 1028 Bedford Dr
- 1390 Merrimac Ln N
- 1168 Chalet Dr
- 1309 Coldspring Rd Unit 162
- 1063 Parkview Cir
- 3935 Shoreline Dr
- 388 Canyon Trail
- 736 Tama Ct
- 385 Wexford Ct Unit 32
- 848 Birchbark Trail
- 676 Quincy Ct
- 877 Malibu Ct
- 1080 Birchbark Trail
- 712 Aztec Dr
- 541 Chippewa Trail
- 716 Sand Creek Dr
- 746 Warwick Ct
- 754 Warwick Ct
- 1073 Regency Ln
- 1065 Regency Ln
- 1083 Regency Ln
- 1090 Buckingham Dr
- 756 Warwick Ct
- 1096 Buckingham Dr
- 1091 Regency Ln
- 1061 Regency Ln
- 1101 Regency Ln
- 753 Warwick Ct
- 755 Warwick Ct
- 745 Warwick Ct
- 1107 Regency Ln
- 741 Warwick Ct
- 1113 Regency Ln
- 1074 Buckingham Dr
- 1070 Regency Ln
- 731 Mayfair Dr