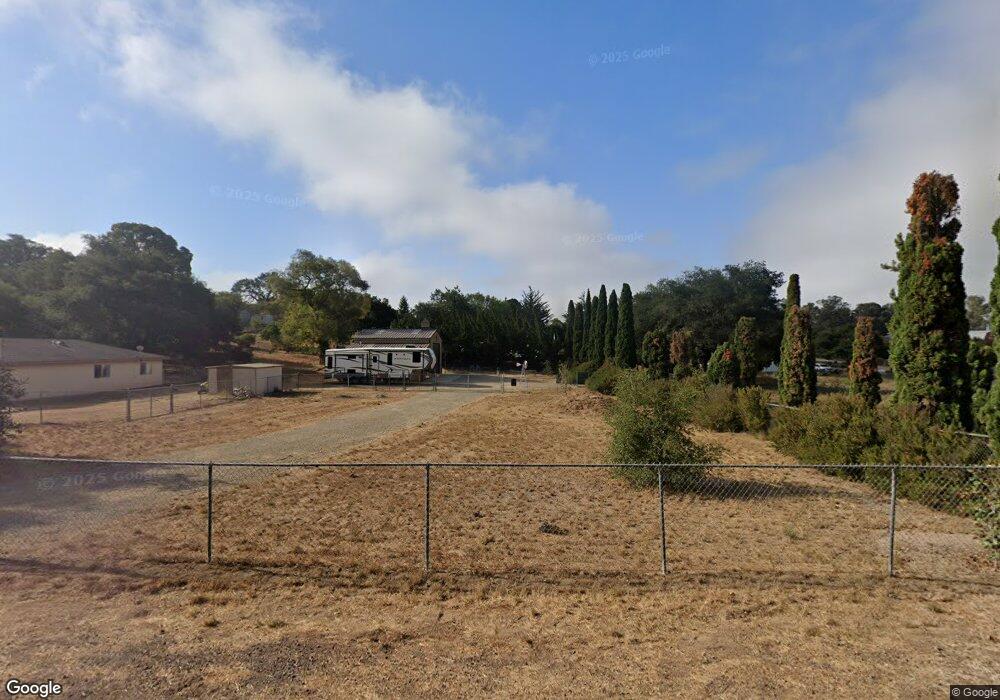
749 Glenhaven Place Nipomo, CA 93444
Estimated Value: $848,000 - $991,000
3
Beds
2
Baths
1,616
Sq Ft
$579/Sq Ft
Est. Value
About This Home
This home is located at 749 Glenhaven Place, Nipomo, CA 93444 and is currently estimated at $934,954, approximately $578 per square foot. 749 Glenhaven Place is a home located in San Luis Obispo County with nearby schools including Dorothea Lange Elementary School, Mesa Middle School, and Nipomo High School.
Ownership History
Date
Name
Owned For
Owner Type
Purchase Details
Closed on
May 28, 2010
Sold by
Shaleen Dennis K
Bought by
Shaleen Dennis K and Shaleen Susan L
Current Estimated Value
Purchase Details
Closed on
Aug 1, 2002
Sold by
Shaleen Dennis K and Shaleen Sandra
Bought by
Shaleen Dennis K and Shaleen Sandra J
Create a Home Valuation Report for This Property
The Home Valuation Report is an in-depth analysis detailing your home's value as well as a comparison with similar homes in the area
Home Values in the Area
Average Home Value in this Area
Purchase History
| Date | Buyer | Sale Price | Title Company |
|---|---|---|---|
| Shaleen Dennis K | -- | None Available | |
| Shaleen Dennis K | -- | None Available | |
| Shaleen Dennis K | -- | -- |
Source: Public Records
Tax History Compared to Growth
Tax History
| Year | Tax Paid | Tax Assessment Tax Assessment Total Assessment is a certain percentage of the fair market value that is determined by local assessors to be the total taxable value of land and additions on the property. | Land | Improvement |
|---|---|---|---|---|
| 2025 | $1,667 | $169,205 | $47,534 | $121,671 |
| 2024 | $1,646 | $165,888 | $46,602 | $119,286 |
| 2023 | $1,646 | $162,637 | $45,689 | $116,948 |
| 2022 | $1,620 | $159,449 | $44,794 | $114,655 |
| 2021 | $1,616 | $156,323 | $43,916 | $112,407 |
| 2020 | $1,596 | $154,721 | $43,466 | $111,255 |
| 2019 | $1,585 | $151,688 | $42,614 | $109,074 |
| 2018 | $1,565 | $148,715 | $41,779 | $106,936 |
| 2017 | $1,534 | $145,800 | $40,960 | $104,840 |
| 2016 | $1,445 | $142,942 | $40,157 | $102,785 |
| 2015 | $1,423 | $140,796 | $39,554 | $101,242 |
| 2014 | $1,207 | $122,469 | $38,780 | $83,689 |
Source: Public Records
Map
Nearby Homes
- 1010 1012 Upper Los Berros Rd
- 620 Camino Roble
- 615 Sweet Donna Place
- 940 Calle Fresa
- 875 Camino Caballo
- 219 Lema Dr
- 7855 Suey Creek Rd
- 217 Hope Way
- 1150 Redberry Place
- 228 Chaparral Ln
- 255 Encino Ln
- 1225 Dawn Rd
- 759 Viola Ct
- 1060 Dawn Rd
- 719 W Tefft St
- 1276 Pomeroy Rd
- 639 Barberry Way
- 680 Hill St
- 1337 Black Sage Cir
- 400 N Oakglen Ave
- 741 Glenhaven Place
- 855 Hana Ln
- 820 Ten Oaks Way
- 738 Pomeroy Rd
- 850 Ten Oaks Way
- 726 Pomeroy Rd
- 825 Hana Ln
- 755 Glenhaven Place
- 769 Glenhaven Place
- 870 Ten Oaks Way
- 752 Glenhaven Place
- 750 Glenhaven Place
- 734 Glenhaven Place
- 845 Camino Rosado Ln
- 750 Pomeroy Rd
- 835 Ten Oaks Way
- 855 Ten Oaks Way
- 752 Pomeroy Rd
- 732 Pomeroy Rd