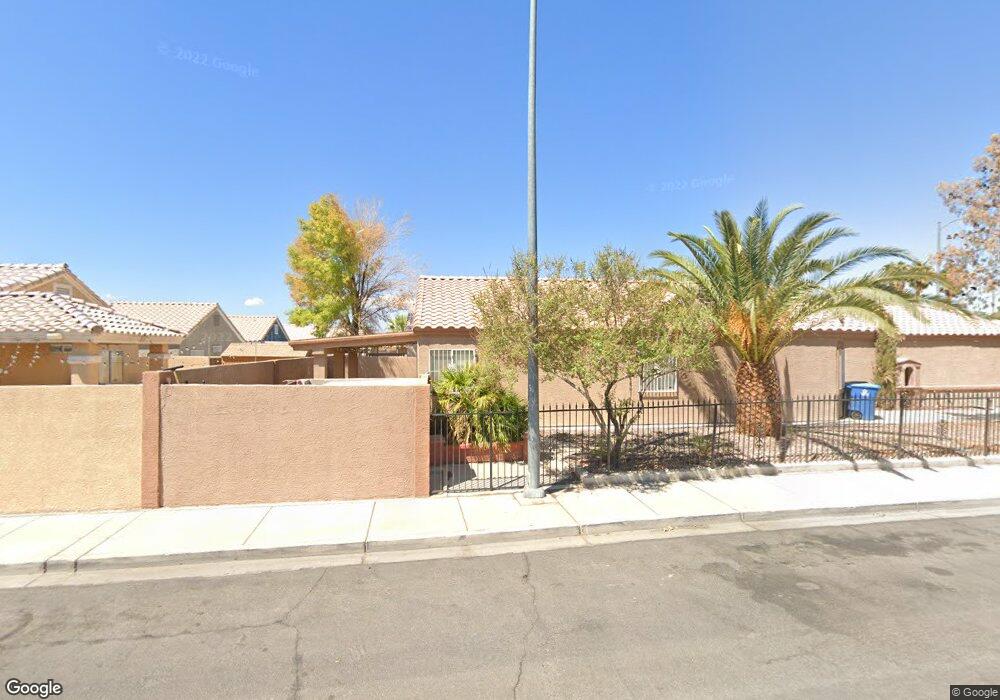
749 Hidden Desert Way Las Vegas, NV 89110
East Las Vegas NeighborhoodEstimated Value: $346,000 - $380,000
3
Beds
2
Baths
1,423
Sq Ft
$255/Sq Ft
Est. Value
About This Home
This home is located at 749 Hidden Desert Way, Las Vegas, NV 89110 and is currently estimated at $363,304, approximately $255 per square foot. 749 Hidden Desert Way is a home located in Clark County with nearby schools including William K. Moore Elementary School, Dell H Robison Middle School, and Desert Pines High School.
Ownership History
Date
Name
Owned For
Owner Type
Purchase Details
Closed on
Feb 7, 1997
Sold by
Ricotta Agnes and Ricotta Joseph P
Bought by
Lopez Roberto
Current Estimated Value
Home Financials for this Owner
Home Financials are based on the most recent Mortgage that was taken out on this home.
Original Mortgage
$102,914
Outstanding Balance
$11,697
Interest Rate
7.62%
Mortgage Type
FHA
Estimated Equity
$351,607
Purchase Details
Closed on
Feb 6, 1997
Sold by
Lopez Margarita
Bought by
Lopez Roberto
Home Financials for this Owner
Home Financials are based on the most recent Mortgage that was taken out on this home.
Original Mortgage
$102,914
Outstanding Balance
$11,697
Interest Rate
7.62%
Mortgage Type
FHA
Estimated Equity
$351,607
Purchase Details
Closed on
Feb 17, 1995
Sold by
Viking Construction Inc
Bought by
Ricotta Agnes and Ricotta Joseph P
Home Financials for this Owner
Home Financials are based on the most recent Mortgage that was taken out on this home.
Original Mortgage
$78,950
Interest Rate
8.43%
Create a Home Valuation Report for This Property
The Home Valuation Report is an in-depth analysis detailing your home's value as well as a comparison with similar homes in the area
Home Values in the Area
Average Home Value in this Area
Purchase History
| Date | Buyer | Sale Price | Title Company |
|---|---|---|---|
| Lopez Roberto | $104,000 | Fidelity National Title | |
| Lopez Roberto | -- | Fidelity National Title | |
| Ricotta Agnes | $99,000 | Land Title |
Source: Public Records
Mortgage History
| Date | Status | Borrower | Loan Amount |
|---|---|---|---|
| Open | Lopez Roberto | $102,914 | |
| Previous Owner | Ricotta Agnes | $78,950 |
Source: Public Records
Tax History Compared to Growth
Tax History
| Year | Tax Paid | Tax Assessment Tax Assessment Total Assessment is a certain percentage of the fair market value that is determined by local assessors to be the total taxable value of land and additions on the property. | Land | Improvement |
|---|---|---|---|---|
| 2025 | $1,192 | $66,457 | $22,050 | $44,407 |
| 2024 | $1,105 | $66,457 | $22,050 | $44,407 |
| 2023 | $1,105 | $67,177 | $24,850 | $42,327 |
| 2022 | $1,023 | $60,071 | $21,350 | $38,721 |
| 2021 | $948 | $55,517 | $18,550 | $36,967 |
| 2020 | $877 | $54,304 | $17,500 | $36,804 |
| 2019 | $822 | $50,429 | $14,000 | $36,429 |
| 2018 | $784 | $43,027 | $11,550 | $31,477 |
| 2017 | $1,483 | $45,247 | $9,800 | $35,447 |
| 2016 | $735 | $37,161 | $7,000 | $30,161 |
| 2015 | $733 | $41,173 | $5,600 | $35,573 |
| 2014 | $711 | $21,050 | $4,200 | $16,850 |
Source: Public Records
Map
Nearby Homes
- 653 Lineshack Ln
- 1405 N Sandhill Rd Unit 2
- 951 N Sandhill Rd
- 3933 Harris Ave
- 3916 Logging Ct
- 4224 Estaban Ct
- 908 Villa Inn Ct
- 4028 Lighthouse Ave
- 4117 Lighthouse Ave
- 3620 Park Oliver Dr
- 1001 Declaration Dr
- 4100 Montebello Ave
- 4108 Montebello Ave
- 917 Snug Harbor St
- 3908 Montebello Ave
- 825 N Lamb Blvd Unit 65
- 825 N Lamb Blvd Unit 186
- 825 N Lamb Blvd Unit 335
- 825 N Lamb Blvd Unit 310
- 825 N Lamb Blvd Unit 223
- 753 Hidden Desert Way Unit 3
- 757 Hidden Desert Way
- 4040 Hidden Oasis Ct
- 4036 Hidden Oasis Ct
- 728 Hidden Desert Way
- 761 Hidden Desert Way
- 724 Hidden Desert Way
- 4032 Hidden Oasis Ct
- 732 Hidden Desert Way
- 720 Hidden Desert Way
- 4028 Hidden Oasis Ct
- 748 Hidden Desert Way
- 752 Hidden Desert Way
- 744 Hidden Desert Way Unit 3
- 4024 Hidden Oasis Ct
- 756 Hidden Desert Way
- 760 Hidden Desert Way
- 712 Hidden Desert Way Unit 2
- 740 Hidden Desert Way