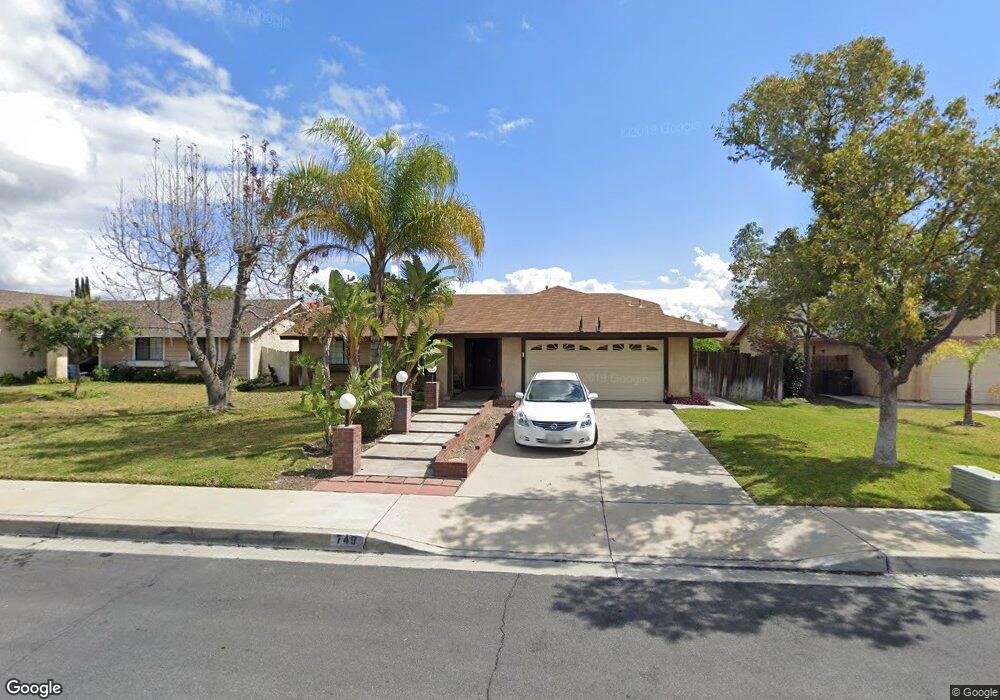
749 S Church Ave Rialto, CA 92376
Estimated Value: $538,000 - $582,000
4
Beds
2
Baths
1,510
Sq Ft
$373/Sq Ft
Est. Value
About This Home
This home is located at 749 S Church Ave, Rialto, CA 92376 and is currently estimated at $562,528, approximately $372 per square foot. 749 S Church Ave is a home with nearby schools including Maple Elementary School, Alder Middle School, and Jurupa Hills High School.
Ownership History
Date
Name
Owned For
Owner Type
Purchase Details
Closed on
Apr 1, 1998
Sold by
Bankers Trust Co Of California Na
Bought by
Heredia Mario A and Heredia Shirley T
Current Estimated Value
Home Financials for this Owner
Home Financials are based on the most recent Mortgage that was taken out on this home.
Original Mortgage
$89,663
Interest Rate
7.07%
Mortgage Type
FHA
Purchase Details
Closed on
Nov 6, 1997
Sold by
Washington Gregory
Bought by
Vendee Mtg Trust 95-1
Purchase Details
Closed on
Nov 15, 1994
Sold by
Va
Bought by
Washington Gregory
Home Financials for this Owner
Home Financials are based on the most recent Mortgage that was taken out on this home.
Original Mortgage
$110,099
Interest Rate
9.08%
Mortgage Type
Seller Take Back
Purchase Details
Closed on
Dec 10, 1993
Sold by
Independence One Mtg Corp
Bought by
Va
Purchase Details
Closed on
Dec 9, 1993
Sold by
Professional Foreclosure Corp
Bought by
Independence One Mtg Corp
Create a Home Valuation Report for This Property
The Home Valuation Report is an in-depth analysis detailing your home's value as well as a comparison with similar homes in the area
Home Values in the Area
Average Home Value in this Area
Purchase History
| Date | Buyer | Sale Price | Title Company |
|---|---|---|---|
| Heredia Mario A | $90,000 | First American Title Co | |
| Vendee Mtg Trust 95-1 | $76,000 | Fidelity National Title Ins | |
| Washington Gregory | $111,000 | Gateway Title Company | |
| Va | -- | First Southwestern Title Com | |
| Independence One Mtg Corp | $99,145 | First Southwestern Title Com |
Source: Public Records
Mortgage History
| Date | Status | Borrower | Loan Amount |
|---|---|---|---|
| Previous Owner | Heredia Mario A | $89,663 | |
| Previous Owner | Washington Gregory | $110,099 |
Source: Public Records
Tax History Compared to Growth
Tax History
| Year | Tax Paid | Tax Assessment Tax Assessment Total Assessment is a certain percentage of the fair market value that is determined by local assessors to be the total taxable value of land and additions on the property. | Land | Improvement |
|---|---|---|---|---|
| 2025 | $2,367 | $156,774 | $39,192 | $117,582 |
| 2024 | $2,367 | $153,700 | $38,424 | $115,276 |
| 2023 | $2,340 | $150,687 | $37,671 | $113,016 |
| 2022 | $2,302 | $147,732 | $36,932 | $110,800 |
| 2021 | $2,278 | $144,835 | $36,208 | $108,627 |
| 2020 | $2,280 | $143,350 | $35,837 | $107,513 |
| 2019 | $2,226 | $140,539 | $35,134 | $105,405 |
| 2018 | $2,235 | $137,783 | $34,445 | $103,338 |
| 2017 | $2,221 | $135,082 | $33,770 | $101,312 |
| 2016 | $1,793 | $132,433 | $33,108 | $99,325 |
| 2015 | $1,770 | $130,444 | $32,611 | $97,833 |
| 2014 | $1,767 | $127,889 | $31,972 | $95,917 |
Source: Public Records
Map
Nearby Homes
- 1157 W Orchard St
- 1459 W James St
- 1560 W Athol St
- 1228 W Woodcrest St
- 806 S Sandalwood Ave
- 1510 W Merrill Ave
- 1028 W Woodcrest St
- 687 S Mandarin Ln
- 646 S Fillmore Ave
- 687 S Fillmore Ave
- 1154 S Spruce Ave
- 18264 Pine Ave Unit a & B
- 18264 Pine Ave
- 703 W Montrose St
- 778 Bloomington Ave
- 9050 Dumond Dr
- 9971 Cedar Ave
- 520 W Randall Ave
- 18239 Orange Way
- 9824 Linden Ave
- 737 S Church Ave
- 761 S Church Ave
- 742 S Vine Ave
- 732 S Vine Ave
- 725 S Church Ave
- 752 S Vine Ave
- 773 S Church Ave
- 1238 W Vodden St
- 1238 W Vodden St
- 1237 W Vodden St
- 762 S Vine Ave
- 722 S Vine Ave
- 713 S Church Ave
- 785 S Church Ave
- 1249 W Voden St
- 1233 W James St
- 1250 W Vodden St
- 1236 W Alru St
- 772 S Vine Ave
- 712 S Vine Ave