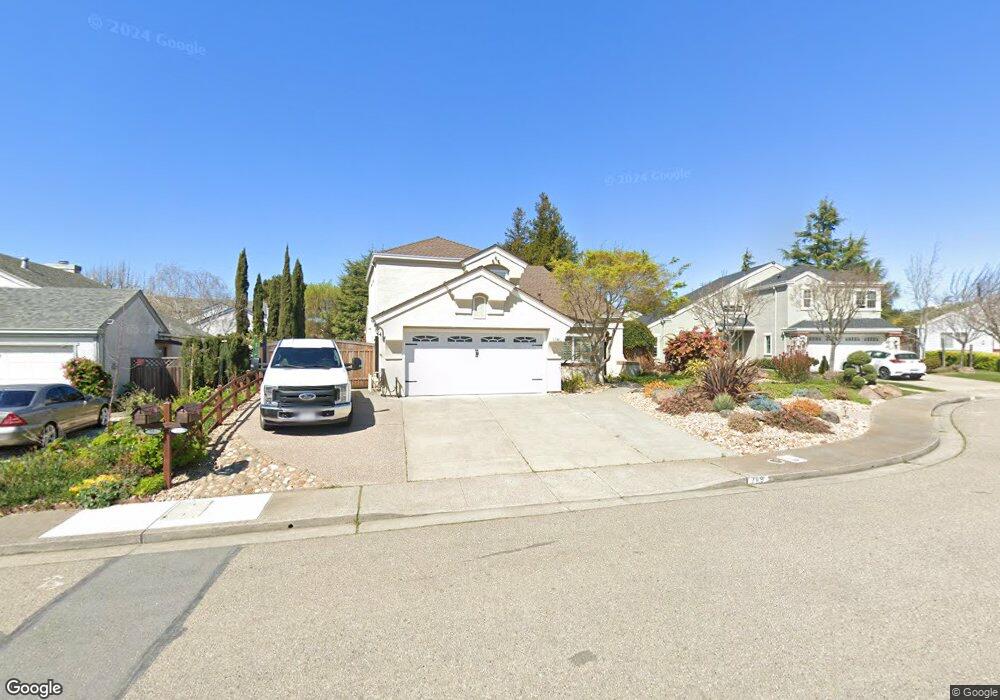
749 Tulip Ct Benicia, CA 94510
Estimated Value: $847,000 - $921,000
3
Beds
2
Baths
1,902
Sq Ft
$460/Sq Ft
Est. Value
About This Home
This home is located at 749 Tulip Ct, Benicia, CA 94510 and is currently estimated at $875,561, approximately $460 per square foot. 749 Tulip Ct is a home located in Solano County with nearby schools including Matthew Turner Elementary School, Benicia Middle School, and Benicia High School.
Ownership History
Date
Name
Owned For
Owner Type
Purchase Details
Closed on
Jan 14, 2014
Sold by
Catrino Alfred A and Catrino Donna R
Bought by
The Alfred A & Donna R Catrino Living Tr and Catrino Donna R
Current Estimated Value
Purchase Details
Closed on
Dec 9, 1993
Sold by
Lowe Erma
Bought by
Catrino Alfred A and Catrino Donna R
Home Financials for this Owner
Home Financials are based on the most recent Mortgage that was taken out on this home.
Original Mortgage
$141,000
Interest Rate
7.09%
Create a Home Valuation Report for This Property
The Home Valuation Report is an in-depth analysis detailing your home's value as well as a comparison with similar homes in the area
Home Values in the Area
Average Home Value in this Area
Purchase History
| Date | Buyer | Sale Price | Title Company |
|---|---|---|---|
| The Alfred A & Donna R Catrino Living Tr | -- | None Available | |
| Catrino Alfred A | $223,000 | North American Title Co Inc |
Source: Public Records
Mortgage History
| Date | Status | Borrower | Loan Amount |
|---|---|---|---|
| Closed | Catrino Alfred A | $141,000 |
Source: Public Records
Tax History Compared to Growth
Tax History
| Year | Tax Paid | Tax Assessment Tax Assessment Total Assessment is a certain percentage of the fair market value that is determined by local assessors to be the total taxable value of land and additions on the property. | Land | Improvement |
|---|---|---|---|---|
| 2025 | $4,748 | $400,147 | $127,475 | $272,672 |
| 2024 | $4,748 | $392,302 | $124,976 | $267,326 |
| 2023 | $4,636 | $384,611 | $122,526 | $262,085 |
| 2022 | $4,550 | $377,071 | $120,124 | $256,947 |
| 2021 | $4,459 | $369,678 | $117,769 | $251,909 |
| 2020 | $4,401 | $365,888 | $116,562 | $249,326 |
| 2019 | $4,101 | $339,793 | $114,277 | $225,516 |
| 2018 | $3,998 | $333,132 | $112,037 | $221,095 |
| 2017 | $3,907 | $326,601 | $109,841 | $216,760 |
| 2016 | $3,933 | $320,198 | $107,688 | $212,510 |
| 2015 | $3,836 | $315,389 | $106,071 | $209,318 |
| 2014 | $3,791 | $309,212 | $103,994 | $205,218 |
Source: Public Records
Map
Nearby Homes