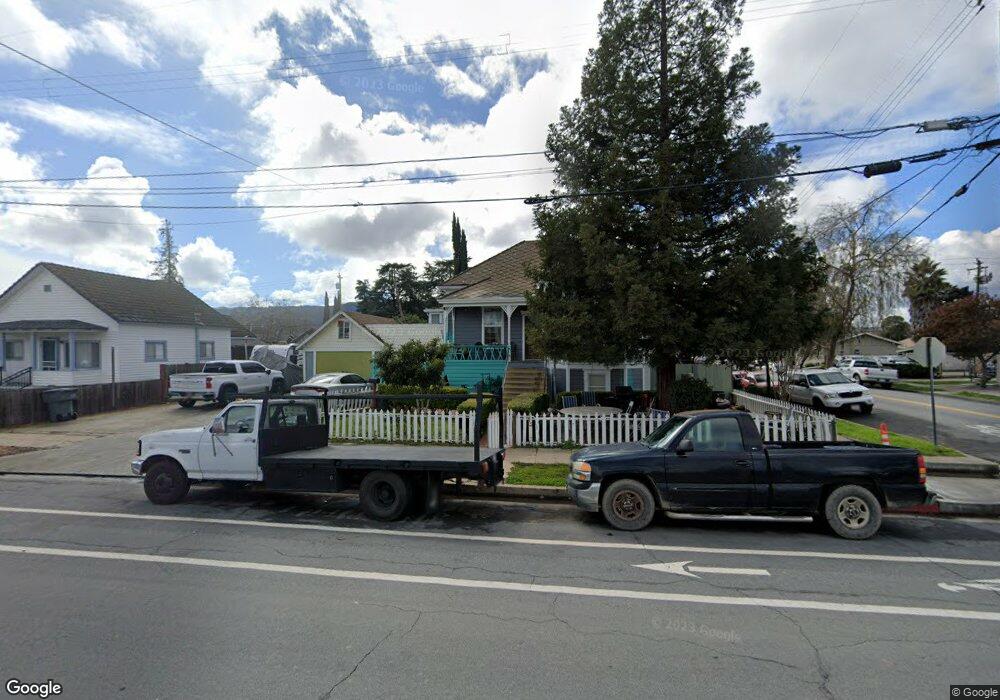
7493 Chestnut St Gilroy, CA 95020
Estimated Value: $650,000 - $845,000
3
Beds
1
Bath
1,408
Sq Ft
$563/Sq Ft
Est. Value
About This Home
This home is located at 7493 Chestnut St, Gilroy, CA 95020 and is currently estimated at $793,022, approximately $563 per square foot. 7493 Chestnut St is a home located in Santa Clara County with nearby schools including Eliot Elementary School, Brownell Middle School, and Solorsano Middle School.
Ownership History
Date
Name
Owned For
Owner Type
Purchase Details
Closed on
May 23, 2015
Sold by
Ching Ching Rental Services Llc
Bought by
Liang Ching and Pau Ching
Current Estimated Value
Purchase Details
Closed on
Dec 14, 2011
Sold by
Liang Ching and Pau Ching
Bought by
Ching Ching Rental Services Llc
Purchase Details
Closed on
Dec 16, 2010
Sold by
U S Bank National Association
Bought by
Liang Ching and Pau Ching
Purchase Details
Closed on
Jul 6, 2010
Sold by
Zuniga Angelica and Magana Jose Z
Bought by
Us Bank National Association
Purchase Details
Closed on
Nov 5, 2004
Sold by
Magana Jose and Zuniga Angelica
Bought by
Magana Jose Z and Zuniga Angelica
Home Financials for this Owner
Home Financials are based on the most recent Mortgage that was taken out on this home.
Original Mortgage
$285,000
Interest Rate
7.15%
Mortgage Type
New Conventional
Purchase Details
Closed on
Oct 10, 1996
Sold by
Mccarn Larry B and Mccarn Janet L
Bought by
Magana Jose and Zuniga Angelica
Home Financials for this Owner
Home Financials are based on the most recent Mortgage that was taken out on this home.
Original Mortgage
$160,550
Interest Rate
7.62%
Create a Home Valuation Report for This Property
The Home Valuation Report is an in-depth analysis detailing your home's value as well as a comparison with similar homes in the area
Home Values in the Area
Average Home Value in this Area
Purchase History
| Date | Buyer | Sale Price | Title Company |
|---|---|---|---|
| Liang Ching | -- | None Available | |
| Ching Ching Rental Services Llc | -- | None Available | |
| Liang Ching | $210,000 | Old Republic Title Co | |
| Us Bank National Association | $221,000 | Accommodation | |
| Magana Jose Z | -- | Alliance Title Company | |
| Magana Jose | $169,000 | American Title Ins Co |
Source: Public Records
Mortgage History
| Date | Status | Borrower | Loan Amount |
|---|---|---|---|
| Previous Owner | Magana Jose Z | $285,000 | |
| Previous Owner | Magana Jose | $160,550 |
Source: Public Records
Tax History Compared to Growth
Tax History
| Year | Tax Paid | Tax Assessment Tax Assessment Total Assessment is a certain percentage of the fair market value that is determined by local assessors to be the total taxable value of land and additions on the property. | Land | Improvement |
|---|---|---|---|---|
| 2025 | $3,366 | $269,031 | $121,064 | $147,967 |
| 2024 | $3,366 | $263,757 | $118,691 | $145,066 |
| 2023 | $3,345 | $258,586 | $116,364 | $142,222 |
| 2022 | $3,289 | $253,517 | $114,083 | $139,434 |
| 2021 | $3,273 | $248,547 | $111,847 | $136,700 |
| 2020 | $3,237 | $246,000 | $110,701 | $135,299 |
| 2019 | $3,208 | $241,178 | $108,531 | $132,647 |
| 2018 | $2,999 | $236,450 | $106,403 | $130,047 |
| 2017 | $3,059 | $231,815 | $104,317 | $127,498 |
| 2016 | $2,991 | $227,271 | $102,272 | $124,999 |
| 2015 | $2,825 | $223,858 | $100,736 | $123,122 |
| 2014 | -- | $219,474 | $98,763 | $120,711 |
Source: Public Records
Map
Nearby Homes
- 7521 Chestnut St
- 332 Lewis St Unit 1/2
- 332 Lewis St
- 7621 Forest St
- 7743 Chestnut St
- 0 Monterey Rd
- 188 Caroline Ln
- 160 Sarafina Way
- 7759 Murray Ave
- 7711 Monterey St
- 194 4th St
- 286 5th St
- 7691 Church St Unit B
- 7191 Eigleberry St
- 7630 Hanna St
- 0 Pacheco Pass Hwy
- 8282 Murray Ave Unit 99
- 8282 Murray Ave Unit 76
- 8180 Forest St
- 7310 Carmel St
- 360 Martin St
- 7475 Chestnut St
- 7461 Chestnut St
- 7505 Chestnut St
- 342 Martin St
- 7492 Chestnut St
- 7496 Chestnut St
- 7451 Chestnut St
- 7515 Chestnut St
- 7472 Chestnut St Unit 1
- 7472 Chestnut St
- 7502 Chestnut St
- 7470 Forest St
- 7458 Chestnut St
- 7498 Forest St
- 311 Martin St
- 7460 Forest St
- 7441 Chestnut St
- 7450 Forest St
- 7522 Chestnut St