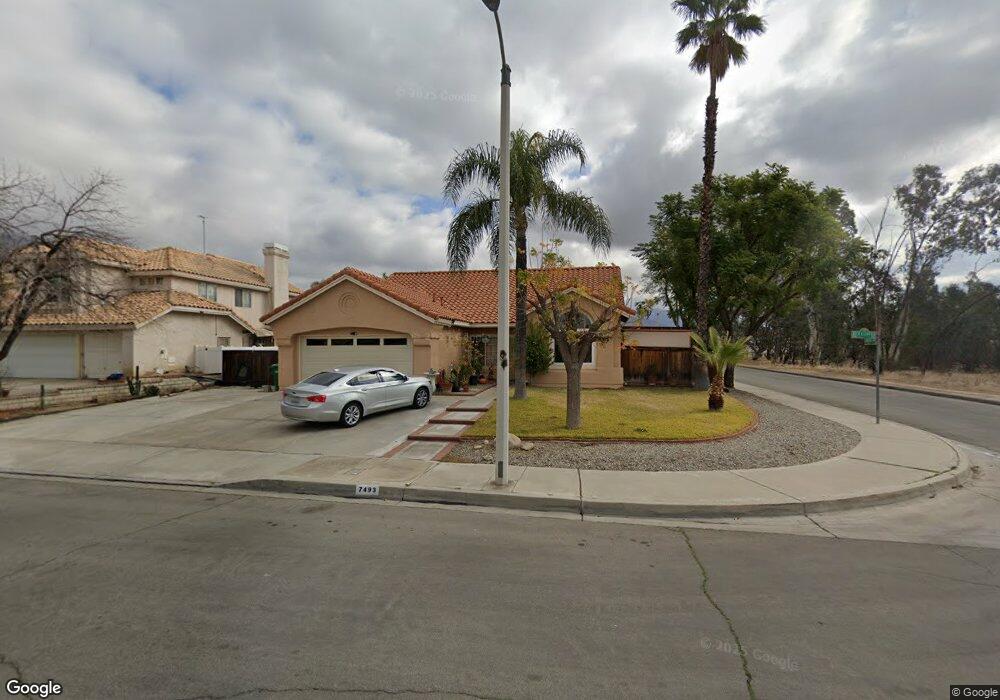
7493 Red Clover Way Highland, CA 92346
East Highlands NeighborhoodEstimated Value: $591,017 - $656,000
3
Beds
2
Baths
1,843
Sq Ft
$344/Sq Ft
Est. Value
About This Home
This home is located at 7493 Red Clover Way, Highland, CA 92346 and is currently estimated at $633,504, approximately $343 per square foot. 7493 Red Clover Way is a home located in San Bernardino County with nearby schools including Highland Grove Elementary School, Beattie Middle School, and Citrus Valley High School.
Ownership History
Date
Name
Owned For
Owner Type
Purchase Details
Closed on
Dec 13, 2024
Sold by
Vaca Terry
Bought by
Terry Vaca Living Trust and Vaca
Current Estimated Value
Purchase Details
Closed on
Aug 4, 2020
Sold by
Vaca Terry
Bought by
Vaca Terry and Gonzalez Lisa Marie
Home Financials for this Owner
Home Financials are based on the most recent Mortgage that was taken out on this home.
Original Mortgage
$125,000
Interest Rate
3%
Mortgage Type
New Conventional
Purchase Details
Closed on
Jun 14, 2018
Sold by
Vaca Steve and Torres Katy
Bought by
Vaca Terry
Home Financials for this Owner
Home Financials are based on the most recent Mortgage that was taken out on this home.
Original Mortgage
$120,000
Interest Rate
4.5%
Mortgage Type
New Conventional
Purchase Details
Closed on
Feb 24, 1999
Sold by
Vaca Gregoria H
Bought by
Vaca Gregoria H and The Gregoria H Vaca Trust
Purchase Details
Closed on
Sep 13, 1997
Sold by
Vaca Gregoria H
Bought by
Vaca Gregoria H and The Gregoria H Vaca Trust
Create a Home Valuation Report for This Property
The Home Valuation Report is an in-depth analysis detailing your home's value as well as a comparison with similar homes in the area
Home Values in the Area
Average Home Value in this Area
Purchase History
| Date | Buyer | Sale Price | Title Company |
|---|---|---|---|
| Terry Vaca Living Trust | -- | None Listed On Document | |
| Terry Vaca Living Trust | -- | None Listed On Document | |
| Vaca Terry | -- | American Coast Title | |
| Vaca Terry | $205,000 | Chicago Title Inland Empire | |
| Vaca Gregoria H | -- | -- | |
| Vaca Gregoria H | -- | -- |
Source: Public Records
Mortgage History
| Date | Status | Borrower | Loan Amount |
|---|---|---|---|
| Previous Owner | Vaca Terry | $125,000 | |
| Previous Owner | Vaca Terry | $120,000 |
Source: Public Records
Tax History Compared to Growth
Tax History
| Year | Tax Paid | Tax Assessment Tax Assessment Total Assessment is a certain percentage of the fair market value that is determined by local assessors to be the total taxable value of land and additions on the property. | Land | Improvement |
|---|---|---|---|---|
| 2025 | $4,670 | $496,801 | $147,035 | $349,766 |
| 2024 | $4,670 | $371,991 | $108,377 | $263,614 |
| 2023 | $4,663 | $364,697 | $106,252 | $258,445 |
| 2022 | $4,593 | $357,546 | $104,169 | $253,377 |
| 2021 | $4,634 | $350,535 | $102,126 | $248,409 |
| 2020 | $4,555 | $346,941 | $101,079 | $245,862 |
| 2019 | $4,419 | $340,138 | $99,097 | $241,041 |
| 2018 | $3,339 | $251,340 | $62,776 | $188,564 |
| 2017 | $3,111 | $246,412 | $61,545 | $184,867 |
| 2016 | $3,076 | $241,580 | $60,338 | $181,242 |
| 2015 | $3,054 | $237,952 | $59,432 | $178,520 |
| 2014 | $2,999 | $233,291 | $58,268 | $175,023 |
Source: Public Records
Map
Nearby Homes
- 7440 Apple Blossom Ct
- 0 Baseline St Unit CV25136921
- 7223 Yarnell Rd
- 28480 Merridy Ave
- 7214 Quail Run Dr
- 27856 Fieldstone Dr
- 7459 Melanie Ct
- 7354 Harding Ct
- 7717 Church Ave Unit 166
- 7717 Church Ave Unit 142
- 7717 Church Ave Unit 160
- 7717 Church Ave Unit 54
- 7717 Church Ave Unit 77
- 7717 Church Ave Unit 214
- 7717 Church Ave Unit 95
- 28390 Burns Ave
- 28037 Clifton St
- 28405 Wild Rose Ln
- 28419 Sunflower St
- 7511 Buckeye St
- 7485 Red Clover Way
- 7496 Apple Blossom Ct
- 7488 Apple Blossom Ct
- 7477 Red Clover Way
- 7482 Apple Blossom Ct
- 7480 Apple Blossom Ct
- 7492 Red Clover Way
- 7498 Red Clover Way
- 7486 Red Clover Way
- 7469 Red Clover Way
- 7472 Apple Blossom Ct
- 7480 Red Clover Way
- 7474 Red Clover Way
- 7464 Apple Blossom Ct
- 7495 Apple Blossom Ct
- 7487 Apple Blossom Ct
- 7479 Apple Blossom Ct
- 7468 Red Clover Way
- 7453 Red Clover Way
- 7471 Apple Blossom Ct