75-11 61st St Unit Building Flushing, NY 11385
Glendale NeighborhoodEstimated Value: $994,070 - $1,345,000
--
Bed
3
Baths
2,280
Sq Ft
$497/Sq Ft
Est. Value
About This Home
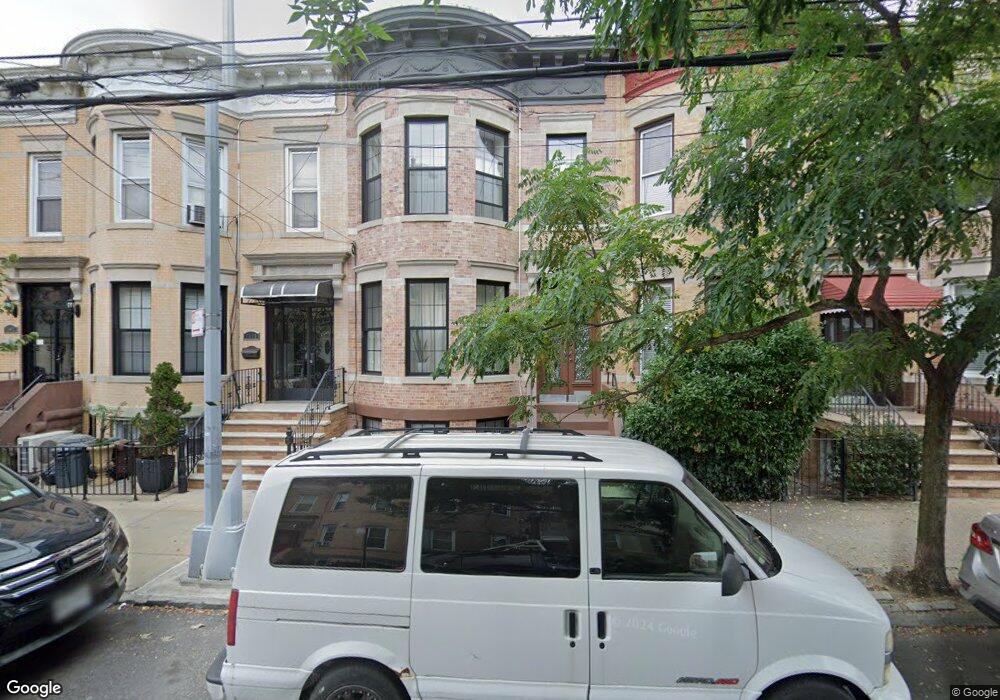
This home is located at 75-11 61st St Unit Building, Flushing, NY 11385 and is currently estimated at $1,134,268, approximately $497 per square foot. 75-11 61st St Unit Building is a home located in Queens County with nearby schools including P.S. 68 - Cambridge, Joseph F. Quinn Intermediate School 77, and Elm Community Charter School.
Ownership History
Date
Name
Owned For
Owner Type
Purchase Details
Closed on
Jan 9, 2019
Sold by
Three Gems Ny Properties Llc
Bought by
Quach Jimmy and Quach Mengyi
Current Estimated Value
Home Financials for this Owner
Home Financials are based on the most recent Mortgage that was taken out on this home.
Original Mortgage
$940,000
Outstanding Balance
$828,121
Interest Rate
4.7%
Mortgage Type
Purchase Money Mortgage
Estimated Equity
$306,147
Purchase Details
Closed on
Jul 25, 2017
Sold by
Hahn Christine and Klimchak John
Bought by
Three Gems Ny Properties Llc
Create a Home Valuation Report for This Property
The Home Valuation Report is an in-depth analysis detailing your home's value as well as a comparison with similar homes in the area
Home Values in the Area
Average Home Value in this Area
Purchase History
| Date | Buyer | Sale Price | Title Company |
|---|---|---|---|
| Quach Jimmy | $1,175,000 | -- | |
| Three Gems Ny Properties Llc | $680,000 | -- |
Source: Public Records
Mortgage History
| Date | Status | Borrower | Loan Amount |
|---|---|---|---|
| Open | Quach Jimmy | $940,000 |
Source: Public Records
Tax History Compared to Growth
Tax History
| Year | Tax Paid | Tax Assessment Tax Assessment Total Assessment is a certain percentage of the fair market value that is determined by local assessors to be the total taxable value of land and additions on the property. | Land | Improvement |
|---|---|---|---|---|
| 2025 | $7,818 | $40,238 | $10,292 | $29,946 |
| 2024 | $7,819 | $38,927 | $11,522 | $27,405 |
| 2023 | $7,376 | $36,725 | $9,857 | $26,868 |
| 2022 | $6,677 | $61,500 | $17,280 | $44,220 |
| 2021 | $7,057 | $55,680 | $17,280 | $38,400 |
| 2020 | $7,098 | $54,660 | $17,280 | $37,380 |
| 2019 | $6,786 | $53,460 | $17,280 | $36,180 |
| 2018 | $6,239 | $30,604 | $9,347 | $21,257 |
| 2017 | $5,989 | $29,378 | $11,418 | $17,960 |
| 2016 | $5,586 | $29,378 | $11,418 | $17,960 |
| 2015 | $3,343 | $27,943 | $13,267 | $14,676 |
| 2014 | $3,343 | $27,033 | $14,813 | $12,220 |
Source: Public Records
Map
Nearby Homes