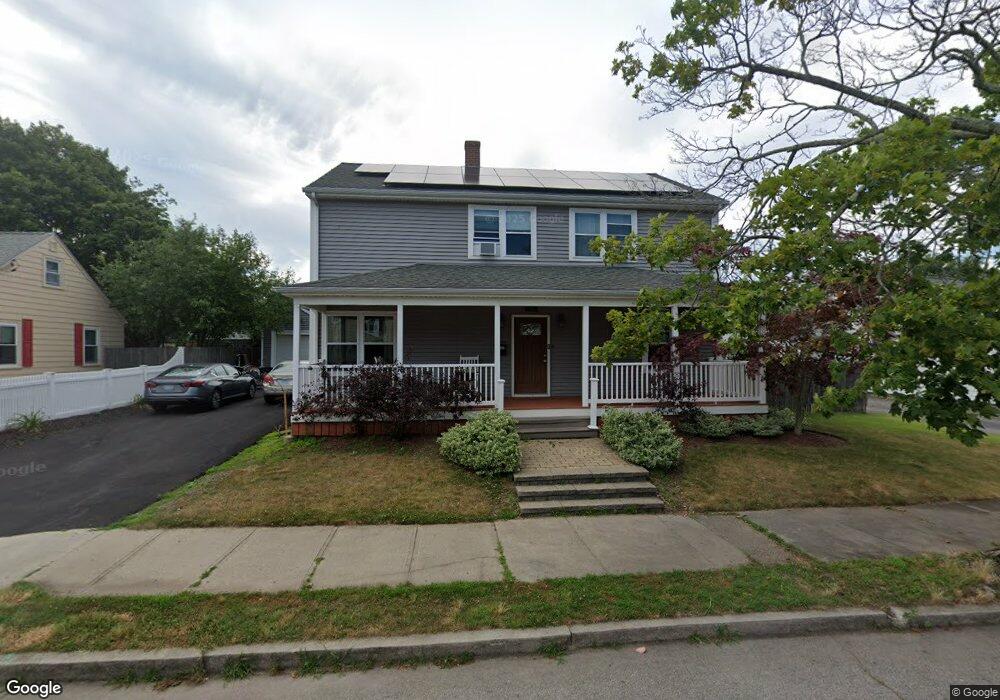
75 2nd St Pawtucket, RI 02861
Darlington NeighborhoodEstimated Value: $427,000 - $570,000
4
Beds
2
Baths
1,848
Sq Ft
$259/Sq Ft
Est. Value
About This Home
This home is located at 75 2nd St, Pawtucket, RI 02861 and is currently estimated at $478,069, approximately $258 per square foot. 75 2nd St is a home located in Providence County with nearby schools including Saint Teresa Catholic Elementary School and St Cecilia School.
Ownership History
Date
Name
Owned For
Owner Type
Purchase Details
Closed on
May 5, 2017
Sold by
Andrew Tammy and Andrew Trevor L
Bought by
Andrew Tammy
Current Estimated Value
Home Financials for this Owner
Home Financials are based on the most recent Mortgage that was taken out on this home.
Original Mortgage
$236,212
Outstanding Balance
$196,205
Interest Rate
4.23%
Mortgage Type
FHA
Estimated Equity
$281,864
Purchase Details
Closed on
Dec 2, 1993
Sold by
Bonneau Noella R and Bonneau James
Bought by
Andrew Trevor L and Costa Elena M
Create a Home Valuation Report for This Property
The Home Valuation Report is an in-depth analysis detailing your home's value as well as a comparison with similar homes in the area
Home Values in the Area
Average Home Value in this Area
Purchase History
| Date | Buyer | Sale Price | Title Company |
|---|---|---|---|
| Andrew Tammy | -- | -- | |
| Andrew Trevor L | $82,500 | -- |
Source: Public Records
Mortgage History
| Date | Status | Borrower | Loan Amount |
|---|---|---|---|
| Open | Andrew Tammy | $236,212 | |
| Previous Owner | Andrew Trevor L | $227,694 | |
| Previous Owner | Andrew Trevor L | $100,000 | |
| Previous Owner | Andrew Trevor L | $60,000 |
Source: Public Records
Tax History Compared to Growth
Tax History
| Year | Tax Paid | Tax Assessment Tax Assessment Total Assessment is a certain percentage of the fair market value that is determined by local assessors to be the total taxable value of land and additions on the property. | Land | Improvement |
|---|---|---|---|---|
| 2025 | $4,767 | $362,500 | $133,200 | $229,300 |
| 2024 | $4,473 | $362,500 | $133,200 | $229,300 |
| 2023 | $5,250 | $309,900 | $89,500 | $220,400 |
| 2022 | $5,138 | $309,900 | $89,500 | $220,400 |
| 2021 | $5,138 | $309,900 | $89,500 | $220,400 |
| 2020 | $4,880 | $233,600 | $74,000 | $159,600 |
| 2019 | $4,880 | $233,600 | $74,000 | $159,600 |
| 2018 | $4,702 | $233,600 | $74,000 | $159,600 |
| 2017 | $4,908 | $216,000 | $68,700 | $147,300 |
| 2016 | $4,728 | $216,000 | $68,700 | $147,300 |
| 2015 | $4,728 | $216,000 | $68,700 | $147,300 |
| 2014 | $4,914 | $213,100 | $65,600 | $147,500 |
Source: Public Records
Map
Nearby Homes