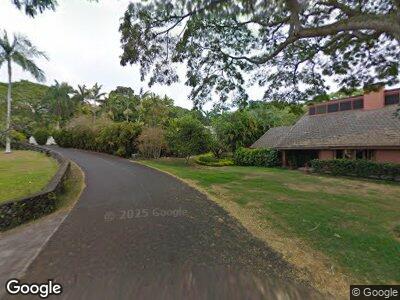
75-800 Hiona St Unit C Holualoa, HI 96725
Kailua Kona NeighborhoodEstimated Value: $1,537,000 - $1,974,000
4
Beds
3
Baths
3,282
Sq Ft
$533/Sq Ft
Est. Value
About This Home
This home is located at 75-800 Hiona St Unit C, Holualoa, HI 96725 and is currently estimated at $1,749,815, approximately $533 per square foot. 75-800 Hiona St Unit C is a home located in Hawaii County with nearby schools including Holualoa Elementary School, Kealakehe Intermediate School, and Kealakehe High School.
Ownership History
Date
Name
Owned For
Owner Type
Purchase Details
Closed on
Feb 6, 2013
Sold by
Stevens Karen V
Bought by
Allen Sean Kawika and Allen Tara
Current Estimated Value
Home Financials for this Owner
Home Financials are based on the most recent Mortgage that was taken out on this home.
Original Mortgage
$280,000
Outstanding Balance
$201,220
Interest Rate
3.34%
Mortgage Type
New Conventional
Estimated Equity
$1,404,361
Purchase Details
Closed on
May 27, 2009
Sold by
Stevens Ronny L
Bought by
Stevens Karen V
Purchase Details
Closed on
Mar 10, 2003
Sold by
Duerr Frederick E
Bought by
Stevens Ronny L and Stevens Karen V
Home Financials for this Owner
Home Financials are based on the most recent Mortgage that was taken out on this home.
Original Mortgage
$375,000
Interest Rate
4%
Purchase Details
Closed on
Feb 26, 1996
Sold by
Duerr Frederick E and Duerr Lynn R
Bought by
Duerr Frederick E and Duerr Lynn R
Create a Home Valuation Report for This Property
The Home Valuation Report is an in-depth analysis detailing your home's value as well as a comparison with similar homes in the area
Home Values in the Area
Average Home Value in this Area
Purchase History
| Date | Buyer | Sale Price | Title Company |
|---|---|---|---|
| Allen Sean Kawika | $510,000 | Tg | |
| Stevens Ronny L | $575,000 | -- | |
| Duerr Frederick E | -- | -- |
Source: Public Records
Mortgage History
| Date | Status | Borrower | Loan Amount |
|---|---|---|---|
| Open | Allen Sean Kawika | $280,000 | |
| Previous Owner | Stevens Ronny L | $625,000 | |
| Previous Owner | Stevens Ronny L | $70,000 | |
| Previous Owner | Stevens Ronny L | $461,000 | |
| Previous Owner | Stevens Ronny L | $100,000 | |
| Previous Owner | Stevens Ronny L | $60,000 | |
| Previous Owner | Stevens Ronny L | $375,000 |
Source: Public Records
Tax History Compared to Growth
Tax History
| Year | Tax Paid | Tax Assessment Tax Assessment Total Assessment is a certain percentage of the fair market value that is determined by local assessors to be the total taxable value of land and additions on the property. | Land | Improvement |
|---|---|---|---|---|
| 2024 | $3,402 | $721,800 | $210,100 | $511,700 |
| 2023 | $3,387 | $700,800 | $210,100 | $490,700 |
| 2022 | $3,446 | $680,400 | $210,100 | $470,300 |
| 2021 | $3,325 | $660,600 | $210,100 | $450,500 |
| 2020 | $3,207 | $641,400 | $210,100 | $431,300 |
| 2019 | $3,092 | $622,700 | $210,100 | $412,600 |
| 2018 | $2,980 | $604,600 | $210,100 | $394,500 |
| 2017 | $2,872 | $587,000 | $210,100 | $376,900 |
| 2016 | $2,767 | $569,900 | $210,100 | $359,800 |
| 2015 | -- | $553,300 | $210,100 | $343,200 |
| 2014 | -- | $548,300 | $204,600 | $343,700 |
Source: Public Records
Map
Nearby Homes
- 75-795 Hiona St
- 75-821 Hiona St
- 75-374 Aloha Kona Dr
- 75-5778 Milena Place
- 75-5822 Neke Place
- 72-111 Pahinahina Place
- 73-4749 Aukai Place
- 75-2620 Keopu Lani Rd
- 75-5786 Kakalina St
- 75-389 Hoene St
- 75-286 Malulani Dr
- 75-5814 Lewa Place
- 75-399 Wehilani Dr
- 75-5811 Nani Kailua Place Unit I
- 75-5641 Hienaloli Rd
- 75-660 Nani Ohai Place
- 75-307 Hoene St
- 75-665 Kula Kai St
- 75-638 Kula Kai St
- 75-1031 Keopu Mauka Dr
- 75-800 Hiona St Unit C
- 75-800 Hiona St Unit B
- 75-800 Hiona St
- 75-800-B Hiona St
- 75-798 Hiona St Unit A
- 75-798 Hiona St Unit B
- 75-798C Hiona St
- 75-802 Hiona St
- 75-796 Hiona St
- 75-789 Hiona St
- 75-797 Hiona St
- 75-786 Hiona St
- 75-816 Hiona St Unit E
- 75-816 Hiona St
- 75-816 Hiona St Unit C
- 75-816 Hiona St Unit D
- 75-816 Hiona St
- 75-816 Hiona St Unit F
- 75-816 Hiona St
- 75-816-D S Lula Au