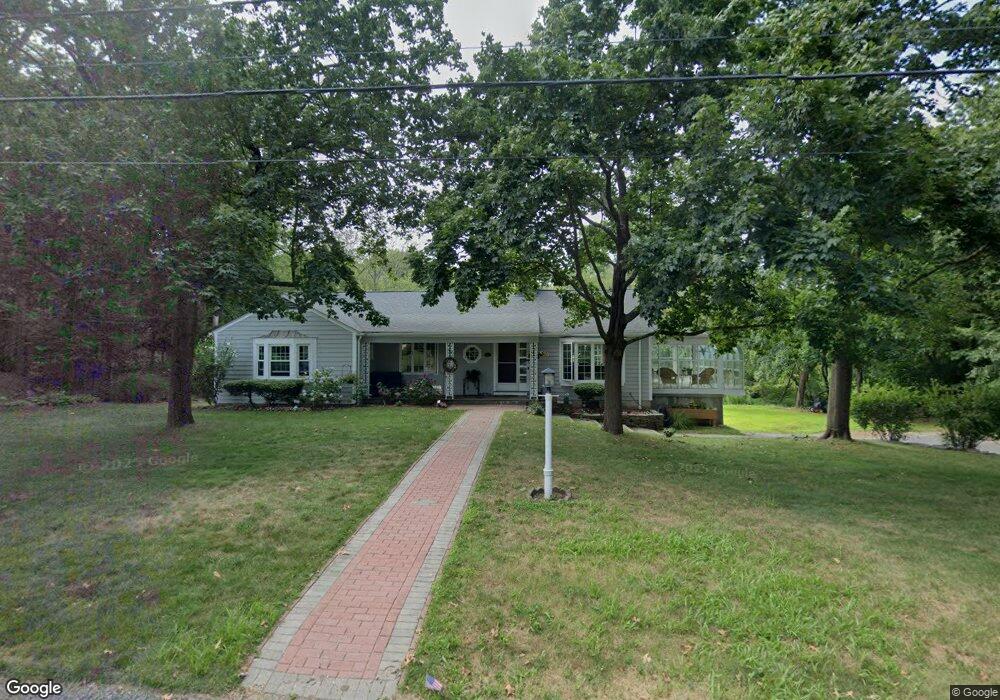
75 Algonquin Dr Warwick, RI 02888
Palace Garden NeighborhoodEstimated Value: $608,000 - $712,000
3
Beds
2
Baths
3,025
Sq Ft
$216/Sq Ft
Est. Value
About This Home
This home is located at 75 Algonquin Dr, Warwick, RI 02888 and is currently estimated at $653,095, approximately $215 per square foot. 75 Algonquin Dr is a home located in Kent County with nearby schools including St. Peter School and Saint Paul School.
Ownership History
Date
Name
Owned For
Owner Type
Purchase Details
Closed on
May 5, 2011
Sold by
Campbell Colleen M and Sangster Mary L
Bought by
Mantaian George A and Mantaian Jean M
Current Estimated Value
Home Financials for this Owner
Home Financials are based on the most recent Mortgage that was taken out on this home.
Original Mortgage
$190,000
Interest Rate
4.82%
Mortgage Type
Purchase Money Mortgage
Purchase Details
Closed on
Aug 4, 2009
Sold by
Harlacker Patricia A
Bought by
Sangster Mary L and Campbell Colleen M
Create a Home Valuation Report for This Property
The Home Valuation Report is an in-depth analysis detailing your home's value as well as a comparison with similar homes in the area
Home Values in the Area
Average Home Value in this Area
Purchase History
| Date | Buyer | Sale Price | Title Company |
|---|---|---|---|
| Mantaian George A | $270,000 | -- | |
| Sangster Mary L | -- | -- | |
| Harlacker Patricia A | -- | -- |
Source: Public Records
Mortgage History
| Date | Status | Borrower | Loan Amount |
|---|---|---|---|
| Open | Harlacker Patricia A | $203,000 | |
| Closed | Harlacker Patricia A | $190,000 |
Source: Public Records
Tax History
| Year | Tax Paid | Tax Assessment Tax Assessment Total Assessment is a certain percentage of the fair market value that is determined by local assessors to be the total taxable value of land and additions on the property. | Land | Improvement |
|---|---|---|---|---|
| 2025 | $6,770 | $533,100 | $193,700 | $339,400 |
| 2024 | $6,574 | $454,300 | $168,800 | $285,500 |
| 2023 | $6,447 | $454,300 | $168,800 | $285,500 |
| 2022 | $5,956 | $318,000 | $107,600 | $210,400 |
| 2021 | $5,956 | $318,000 | $107,600 | $210,400 |
| 2020 | $5,956 | $318,000 | $107,600 | $210,400 |
| 2019 | $5,956 | $318,000 | $107,600 | $210,400 |
| 2018 | $5,077 | $244,100 | $98,300 | $145,800 |
| 2017 | $4,941 | $244,100 | $98,300 | $145,800 |
| 2016 | $4,941 | $244,100 | $98,300 | $145,800 |
| 2015 | $5,576 | $268,700 | $127,100 | $141,600 |
| 2014 | $5,390 | $268,700 | $127,100 | $141,600 |
| 2013 | $5,318 | $268,700 | $127,100 | $141,600 |
Source: Public Records
Map
Nearby Homes
- 1020 Warwick Ave
- 34 N Country Club Dr
- 52 Dahlia St
- 408 Fair St
- 15 Shadbush Rd
- 63 Benbridge Ave
- 56 Errol St
- 40 Lane 1
- 375 Namquid Dr
- 48 Lane 2
- 15 Christopher Rhodes Way
- 6 Christopher Rhodes Way
- 20 Commodore Ave
- 72 W Shore Rd Unit 104
- 72 W Shore Rd Unit 3
- 68 Lane 5
- 179 Lane 4
- 400 Narragansett Pkwy Unit WA11
- 400 Narragansett Pkwy Unit NB1
- 400 Narragansett Pkwy Unit SC7
Your Personal Tour Guide
Ask me questions while you tour the home.