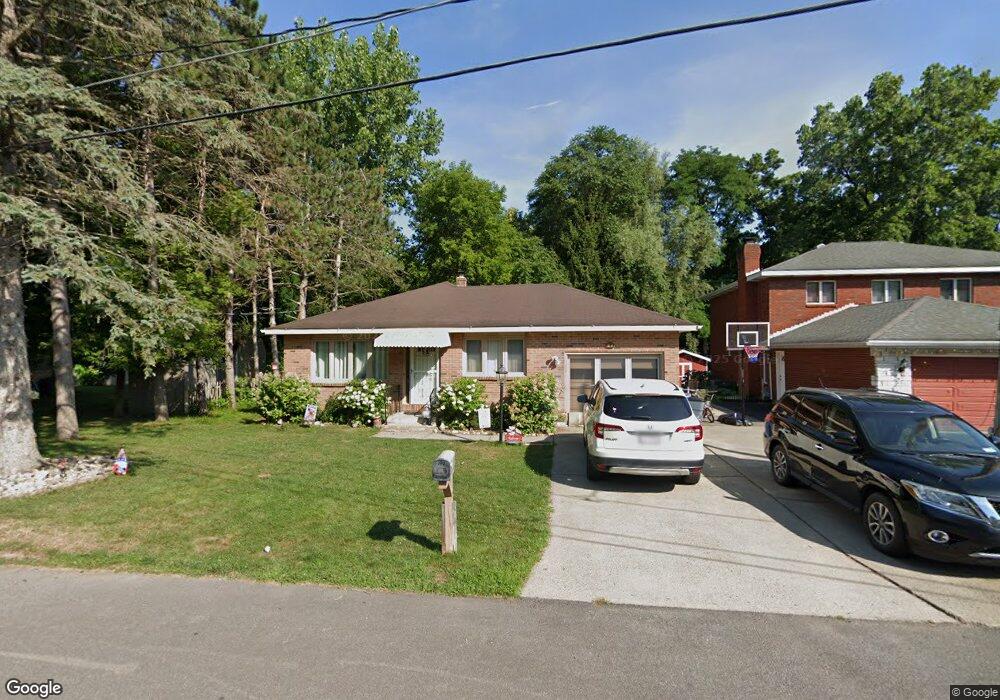
75 Briar Ave Albany, NY 12203
Campus Area NeighborhoodEstimated Value: $307,000 - $370,382
3
Beds
2
Baths
1,700
Sq Ft
$193/Sq Ft
Est. Value
About This Home
This home is located at 75 Briar Ave, Albany, NY 12203 and is currently estimated at $328,846, approximately $193 per square foot. 75 Briar Ave is a home located in Albany County with nearby schools including Eagle Point Elementary School, William S Hackett Middle School, and Albany High School.
Ownership History
Date
Name
Owned For
Owner Type
Purchase Details
Closed on
Dec 17, 2018
Sold by
Sgambelluri Francis J
Bought by
Hallenbeck Ashley Ann
Current Estimated Value
Home Financials for this Owner
Home Financials are based on the most recent Mortgage that was taken out on this home.
Original Mortgage
$110,000
Outstanding Balance
$97,106
Interest Rate
4.9%
Mortgage Type
New Conventional
Estimated Equity
$231,740
Create a Home Valuation Report for This Property
The Home Valuation Report is an in-depth analysis detailing your home's value as well as a comparison with similar homes in the area
Home Values in the Area
Average Home Value in this Area
Purchase History
| Date | Buyer | Sale Price | Title Company |
|---|---|---|---|
| Hallenbeck Ashley Ann | $170,000 | None Available |
Source: Public Records
Mortgage History
| Date | Status | Borrower | Loan Amount |
|---|---|---|---|
| Open | Hallenbeck Ashley Ann | $110,000 |
Source: Public Records
Tax History Compared to Growth
Tax History
| Year | Tax Paid | Tax Assessment Tax Assessment Total Assessment is a certain percentage of the fair market value that is determined by local assessors to be the total taxable value of land and additions on the property. | Land | Improvement |
|---|---|---|---|---|
| 2024 | $9,653 | $352,000 | $70,400 | $281,600 |
| 2023 | $8,329 | $209,000 | $42,000 | $167,000 |
| 2022 | $8,145 | $209,000 | $42,000 | $167,000 |
| 2021 | $8,127 | $209,000 | $42,000 | $167,000 |
| 2020 | $8,068 | $209,000 | $42,000 | $167,000 |
| 2019 | $8,228 | $209,000 | $42,000 | $167,000 |
| 2018 | $2,220 | $209,000 | $42,000 | $167,000 |
| 2017 | $909 | $209,000 | $42,000 | $167,000 |
| 2016 | $2,219 | $209,000 | $42,000 | $167,000 |
| 2015 | $2,237 | $220,000 | $46,600 | $173,400 |
| 2014 | -- | $220,000 | $46,600 | $173,400 |
Source: Public Records
Map
Nearby Homes