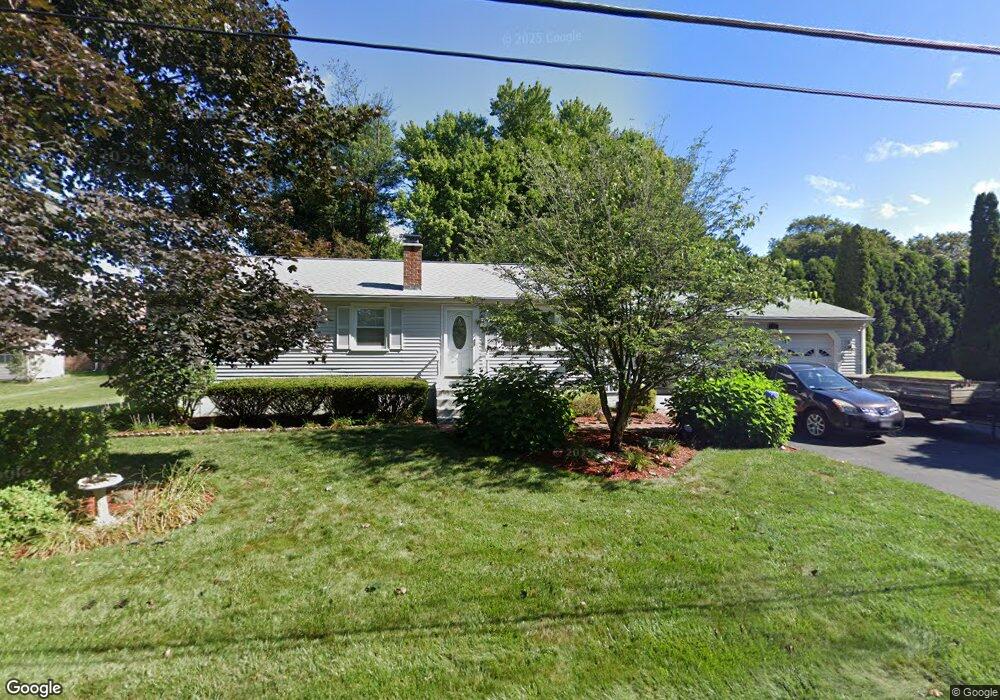
75 Camden St South Hadley, MA 01075
Estimated Value: $328,000 - $390,000
2
Beds
2
Baths
1,122
Sq Ft
$310/Sq Ft
Est. Value
About This Home
This home is located at 75 Camden St, South Hadley, MA 01075 and is currently estimated at $347,382, approximately $309 per square foot. 75 Camden St is a home located in Hampshire County with nearby schools including Plains Elementary School, Mosier Elementary School, and Michael E. Smith Middle School.
Ownership History
Date
Name
Owned For
Owner Type
Purchase Details
Closed on
Feb 10, 2023
Sold by
Grochowalski Frank W and Grochowalski Patricia A
Bought by
Grochowalski Irt
Current Estimated Value
Purchase Details
Closed on
Jan 18, 1972
Bought by
Grochowalski Frank W and Grochowalski P
Create a Home Valuation Report for This Property
The Home Valuation Report is an in-depth analysis detailing your home's value as well as a comparison with similar homes in the area
Home Values in the Area
Average Home Value in this Area
Purchase History
| Date | Buyer | Sale Price | Title Company |
|---|---|---|---|
| Grochowalski Irt | -- | None Available | |
| Grochowalski Frank W | -- | -- |
Source: Public Records
Mortgage History
| Date | Status | Borrower | Loan Amount |
|---|---|---|---|
| Previous Owner | Grochowalski Frank W | $82,700 | |
| Previous Owner | Grochowalski Frank W | $56,000 | |
| Previous Owner | Grochowalski Frank W | $25,000 | |
| Previous Owner | Grochowalski Frank W | $20,000 |
Source: Public Records
Tax History Compared to Growth
Tax History
| Year | Tax Paid | Tax Assessment Tax Assessment Total Assessment is a certain percentage of the fair market value that is determined by local assessors to be the total taxable value of land and additions on the property. | Land | Improvement |
|---|---|---|---|---|
| 2025 | $4,696 | $294,800 | $92,500 | $202,300 |
| 2024 | $4,705 | $282,600 | $86,500 | $196,100 |
| 2023 | $4,321 | $246,200 | $78,600 | $167,600 |
| 2022 | $4,115 | $222,700 | $78,600 | $144,100 |
| 2021 | $4,055 | $208,400 | $73,400 | $135,000 |
| 2020 | $3,972 | $199,200 | $73,400 | $125,800 |
| 2019 | $3,762 | $186,700 | $69,900 | $116,800 |
| 2018 | $3,619 | $181,600 | $67,800 | $113,800 |
| 2017 | $3,491 | $173,500 | $67,800 | $105,700 |
| 2016 | $3,204 | $161,400 | $67,800 | $93,600 |
| 2015 | $3,041 | $156,900 | $65,800 | $91,100 |
Source: Public Records
Map
Nearby Homes