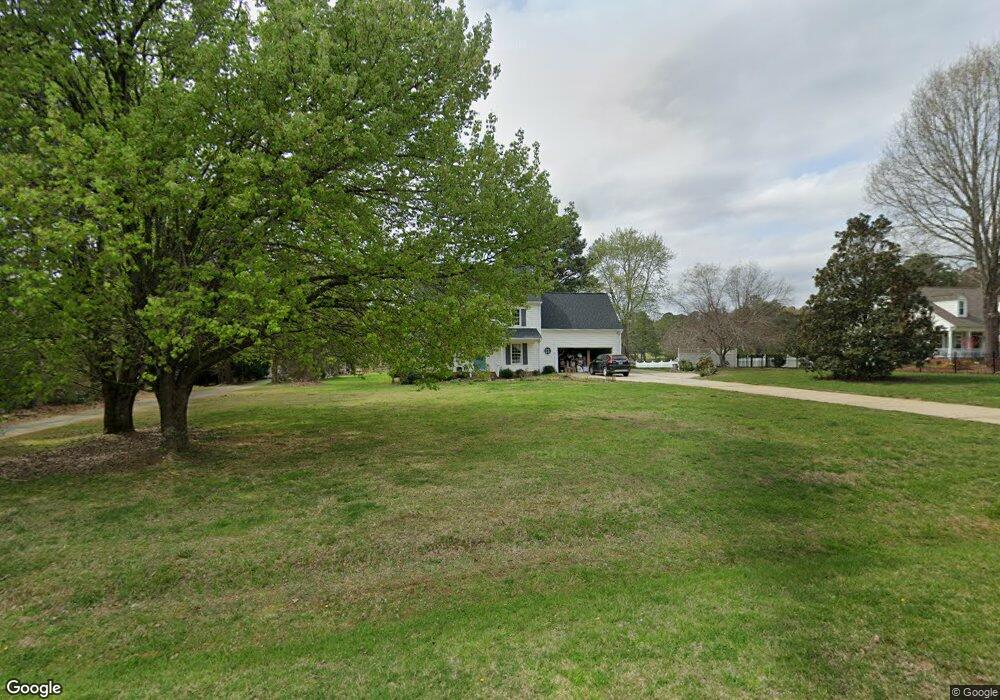
75 Cedar Run Pittsboro, NC 27312
Estimated Value: $503,171 - $651,000
3
Beds
3
Baths
2,280
Sq Ft
$243/Sq Ft
Est. Value
About This Home
This home is located at 75 Cedar Run, Pittsboro, NC 27312 and is currently estimated at $553,793, approximately $242 per square foot. 75 Cedar Run is a home located in Chatham County with nearby schools including Pittsboro Elementary School, George Moses Horton Middle School, and Northwood High.
Ownership History
Date
Name
Owned For
Owner Type
Purchase Details
Closed on
Nov 22, 2019
Sold by
Norton Michael A and Norton Holly W
Bought by
Norton Holly W
Current Estimated Value
Purchase Details
Closed on
May 23, 2016
Sold by
Sueno Llc
Bought by
Norton Michael A and Norton Holly W
Purchase Details
Closed on
Mar 17, 2011
Sold by
Degeer Gutschenritter Michele D and Degeer Amyx Michelle
Bought by
Amyx Michelle Degeer
Home Financials for this Owner
Home Financials are based on the most recent Mortgage that was taken out on this home.
Original Mortgage
$216,300
Interest Rate
4.92%
Mortgage Type
New Conventional
Purchase Details
Closed on
May 6, 2009
Sold by
Gutschenritter Michael B and Gutschenritter Michele D
Bought by
Gutschenritter Michele D
Create a Home Valuation Report for This Property
The Home Valuation Report is an in-depth analysis detailing your home's value as well as a comparison with similar homes in the area
Home Values in the Area
Average Home Value in this Area
Purchase History
| Date | Buyer | Sale Price | Title Company |
|---|---|---|---|
| Norton Holly W | -- | None Available | |
| Norton Michael A | $175,000 | Attorney | |
| Amyx Michelle Degeer | -- | Boston National | |
| Gutschenritter Michele D | -- | None Available |
Source: Public Records
Mortgage History
| Date | Status | Borrower | Loan Amount |
|---|---|---|---|
| Previous Owner | Amyx Michelle Degeer | $216,300 |
Source: Public Records
Tax History Compared to Growth
Tax History
| Year | Tax Paid | Tax Assessment Tax Assessment Total Assessment is a certain percentage of the fair market value that is determined by local assessors to be the total taxable value of land and additions on the property. | Land | Improvement |
|---|---|---|---|---|
| 2025 | $3,700 | $499,027 | $110,000 | $389,027 |
| 2024 | $3,700 | $305,273 | $60,000 | $245,273 |
| 2023 | $2,785 | $305,273 | $60,000 | $245,273 |
| 2022 | $2,541 | $305,273 | $60,000 | $245,273 |
| 2021 | $2,541 | $305,273 | $60,000 | $245,273 |
| 2020 | $2,365 | $282,645 | $50,000 | $232,645 |
| 2019 | $2,222 | $264,648 | $50,000 | $214,648 |
| 2018 | $2,111 | $264,648 | $50,000 | $214,648 |
| 2017 | $2,111 | $264,648 | $50,000 | $214,648 |
| 2016 | $2,151 | $267,858 | $50,000 | $217,858 |
| 2015 | $2,139 | $267,858 | $50,000 | $217,858 |
| 2014 | $2,125 | $267,858 | $50,000 | $217,858 |
| 2013 | -- | $267,858 | $50,000 | $217,858 |
Source: Public Records
Map
Nearby Homes
- 226 John Williams Ln
- 520 Swim and Croquet
- 127 Preston Trace
- 0 Robert Alston Jr Dr Unit 2491587
- TBD Alston Horton Service Rd
- 259 August Trce Dr
- CHANLEY Plan at Corbett Landing
- CHAMPLAIN Plan at Corbett Landing
- ELMSDALE Plan at Corbett Landing
- SEBASTIAN Plan at Corbett Landing
- DRESDEN Plan at Corbett Landing
- BALLENTINE Plan at Corbett Landing
- PARKETTE Plan at Corbett Landing
- MARABELLE Plan at Corbett Landing
- KENDALL Plan at Corbett Landing
- THEODORE Plan at Corbett Landing
- BRANFORD Plan at Corbett Landing
- KAITLYN Plan at Corbett Landing
- 236 Gaines Trail
- 63 Loggers
- 109 Cedar Run
- 35 Cedar Run
- 145 Cedar Run
- 48 Cedar Run
- 112 Cedar Run
- 0 X Campbell Rd Unit 1885850
- 0 X Campbell Rd Unit 977432
- 0 X Campbell Rd Unit 799187
- 0 X Campbell Rd Unit 2 TR977432
- 0 X Campbell Rd Unit TR1741029
- 0 X Campbell Rd
- 853 X Campbell Rd
- 173 Cedar Run
- 78 Cedar Run
- 20 Cedar Run
- 146 Cedar Run
- 935 X Campbell Rd
- 189 Cedar Run
- 763 X Campbell Rd
- 763 X-Campbell Rd