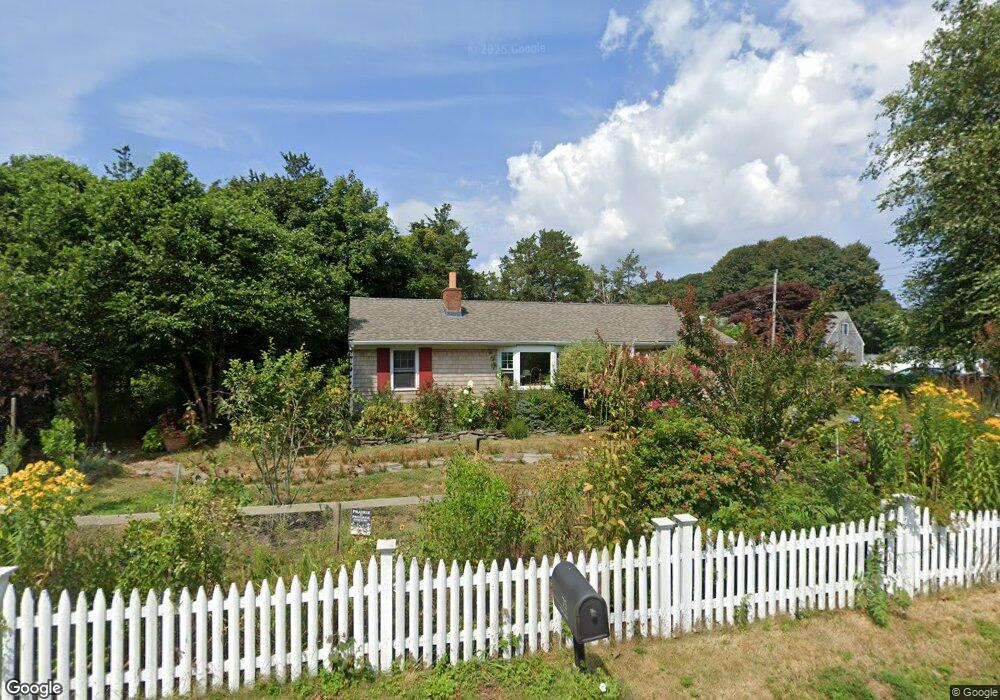
75 Cod Ln Chatham, MA 02633
Chatham Village NeighborhoodEstimated Value: $662,000 - $874,000
3
Beds
1
Bath
924
Sq Ft
$823/Sq Ft
Est. Value
About This Home
This home is located at 75 Cod Ln, Chatham, MA 02633 and is currently estimated at $759,993, approximately $822 per square foot. 75 Cod Ln is a home located in Barnstable County with nearby schools including Chatham Elementary School, Harwich Elementary School, and Monomoy Regional Middle School.
Ownership History
Date
Name
Owned For
Owner Type
Purchase Details
Closed on
Jun 16, 1995
Sold by
Great American Life In
Bought by
Hatch Thomas and Hatch Wendy
Current Estimated Value
Home Financials for this Owner
Home Financials are based on the most recent Mortgage that was taken out on this home.
Original Mortgage
$103,588
Interest Rate
8.24%
Mortgage Type
Purchase Money Mortgage
Create a Home Valuation Report for This Property
The Home Valuation Report is an in-depth analysis detailing your home's value as well as a comparison with similar homes in the area
Home Values in the Area
Average Home Value in this Area
Purchase History
| Date | Buyer | Sale Price | Title Company |
|---|---|---|---|
| Hatch Thomas | $103,588 | -- |
Source: Public Records
Mortgage History
| Date | Status | Borrower | Loan Amount |
|---|---|---|---|
| Open | Hatch Thomas | $50,000 | |
| Open | Hatch Thomas | $113,500 | |
| Closed | Hatch Thomas | $103,000 | |
| Closed | Hatch Thomas | $103,588 |
Source: Public Records
Tax History
| Year | Tax Paid | Tax Assessment Tax Assessment Total Assessment is a certain percentage of the fair market value that is determined by local assessors to be the total taxable value of land and additions on the property. | Land | Improvement |
|---|---|---|---|---|
| 2025 | $1,827 | $526,600 | $342,800 | $183,800 |
| 2024 | $1,775 | $497,100 | $323,400 | $173,700 |
| 2023 | $1,642 | $423,100 | $269,500 | $153,600 |
| 2022 | $1,881 | $407,200 | $314,400 | $92,800 |
| 2021 | $1,853 | $372,000 | $285,800 | $86,200 |
| 2020 | $1,893 | $392,800 | $306,200 | $86,600 |
| 2019 | $1,815 | $374,300 | $286,300 | $88,000 |
| 2018 | $1,788 | $367,200 | $286,300 | $80,900 |
| 2017 | $1,806 | $359,000 | $277,900 | $81,100 |
| 2016 | $1,780 | $354,600 | $272,500 | $82,100 |
| 2015 | $1,592 | $319,100 | $238,300 | $80,800 |
| 2014 | $1,621 | $319,100 | $238,300 | $80,800 |
Source: Public Records
Map
Nearby Homes
- 230 Barcliff Ave
- 23 Shane Dr
- 27 Martha Kendrick Dr
- 231 Crowell Rd
- 39 Meadow Brook Rd
- 109 Misty Meadow Ln Unit 4
- 745 Main St
- 28 Cranberry Ln
- 28 Cranberry Ln
- 121 Queen Anne Rd
- 41 Court St
- 101 Oyster Pond Furlong St
- 207 Horizon Dr
- 425 Main St Unit D
- 425 Main St Unit D
- 238 Cranberry Ln
- 99 Uncle Alberts Drive Extension
- 85 Cedar St
- 32 Sunset Ln
- 292 Stage Harbor Rd
Your Personal Tour Guide
Ask me questions while you tour the home.