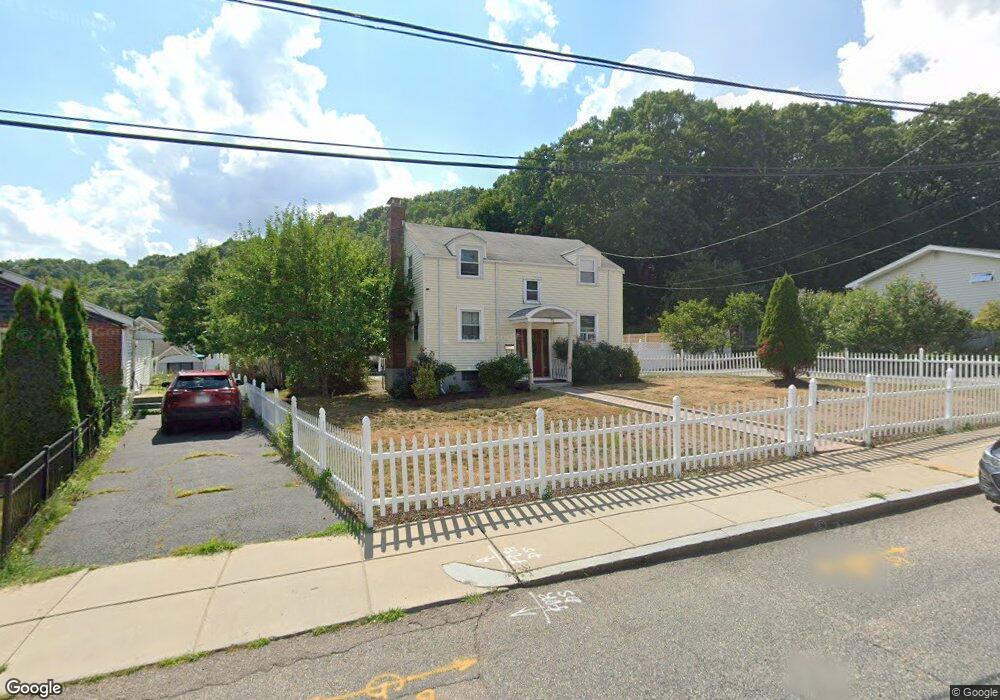
75 Dale St Roslindale, MA 02131
Roslindale NeighborhoodEstimated Value: $745,000 - $838,000
4
Beds
2
Baths
1,600
Sq Ft
$495/Sq Ft
Est. Value
About This Home
This home is located at 75 Dale St, Roslindale, MA 02131 and is currently estimated at $792,693, approximately $495 per square foot. 75 Dale St is a home located in Suffolk County with nearby schools including Brooke Charter School Roslindale, Sacred Heart STEM School, and St. Clare High School.
Ownership History
Date
Name
Owned For
Owner Type
Purchase Details
Closed on
Aug 27, 2001
Sold by
Dale St Rt 75
Bought by
Valmond Hubert
Current Estimated Value
Home Financials for this Owner
Home Financials are based on the most recent Mortgage that was taken out on this home.
Original Mortgage
$220,000
Interest Rate
7.21%
Mortgage Type
Purchase Money Mortgage
Create a Home Valuation Report for This Property
The Home Valuation Report is an in-depth analysis detailing your home's value as well as a comparison with similar homes in the area
Home Values in the Area
Average Home Value in this Area
Purchase History
| Date | Buyer | Sale Price | Title Company |
|---|---|---|---|
| Valmond Hubert | $255,000 | -- |
Source: Public Records
Mortgage History
| Date | Status | Borrower | Loan Amount |
|---|---|---|---|
| Open | Valmond Hubert | $242,000 | |
| Closed | Valmond Hubert | $234,000 | |
| Closed | Valmond Hubert | $220,000 | |
| Previous Owner | Valmond Hubert | $15,000 |
Source: Public Records
Tax History Compared to Growth
Tax History
| Year | Tax Paid | Tax Assessment Tax Assessment Total Assessment is a certain percentage of the fair market value that is determined by local assessors to be the total taxable value of land and additions on the property. | Land | Improvement |
|---|---|---|---|---|
| 2025 | $7,350 | $634,700 | $289,300 | $345,400 |
| 2024 | $6,282 | $576,300 | $240,200 | $336,100 |
| 2023 | $5,837 | $543,500 | $226,500 | $317,000 |
| 2022 | $5,376 | $494,100 | $205,900 | $288,200 |
| 2021 | $4,894 | $458,700 | $198,000 | $260,700 |
| 2020 | $4,701 | $445,200 | $180,000 | $265,200 |
| 2019 | $4,243 | $402,600 | $156,600 | $246,000 |
| 2018 | $4,017 | $383,300 | $156,600 | $226,700 |
| 2017 | $3,827 | $361,400 | $156,600 | $204,800 |
| 2016 | $3,937 | $357,900 | $156,600 | $201,300 |
| 2015 | $4,280 | $353,400 | $172,800 | $180,600 |
| 2014 | $4,151 | $330,000 | $172,800 | $157,200 |
Source: Public Records
Map
Nearby Homes
- 42 Doncaster St
- 273 Metropolitan Ave Unit 2
- 15 Cornell St
- 30 Macdonald St
- 15 Beechmont Terrace
- 175 Clare Ave Unit B2
- 895 Hyde Park Ave Unit 2
- 492 Metropolitan Ave
- 87 Clare Ave
- 75 Glendower Rd
- 514 Metropolitan Ave Unit 514A
- 57 Hemman St
- 89 Glendower Rd
- 307 West St
- 142 Metropolitan Ave Unit A
- 61 Whitford St
- 16 Hilburn Place
- 42 Wilmot St
- 4 Rowe Ct
- 25 Crandall St