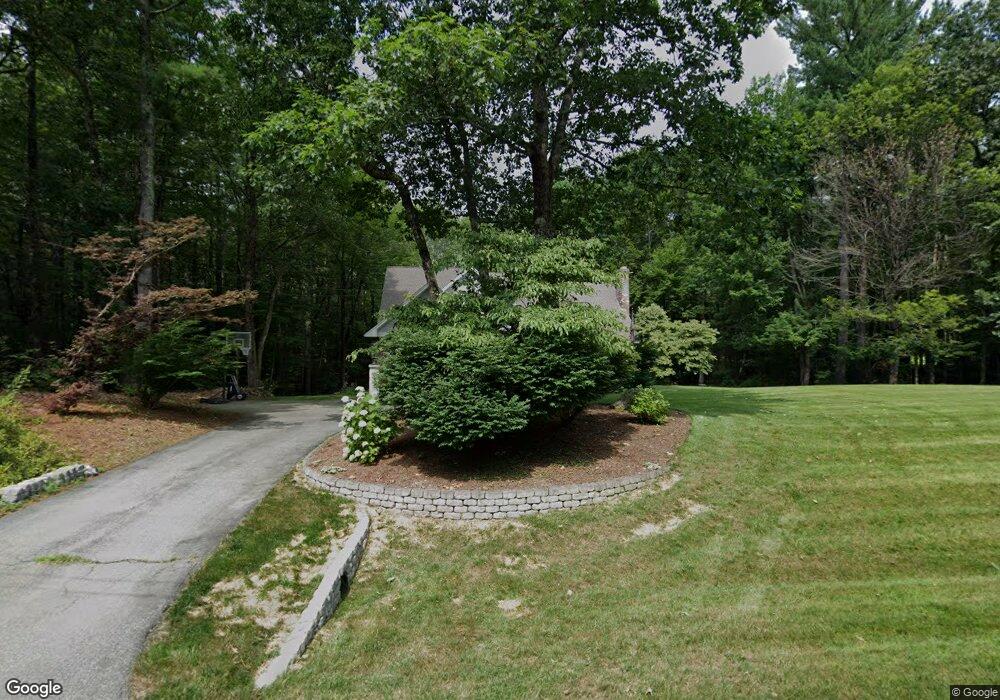
75 Deacon Ln Hollis, NH 03049
Hollis NeighborhoodEstimated Value: $733,000 - $900,000
3
Beds
3
Baths
2,514
Sq Ft
$312/Sq Ft
Est. Value
About This Home
This home is located at 75 Deacon Ln, Hollis, NH 03049 and is currently estimated at $784,765, approximately $312 per square foot. 75 Deacon Ln is a home with nearby schools including Hollis Primary School, Hollis Upper Elementary School, and Hollis-Brookline Middle School.
Ownership History
Date
Name
Owned For
Owner Type
Purchase Details
Closed on
Jun 15, 2022
Sold by
R W & Jean C Burns Irt and Burns
Bought by
Stauble Shari L and Stauble David A
Current Estimated Value
Home Financials for this Owner
Home Financials are based on the most recent Mortgage that was taken out on this home.
Original Mortgage
$483,000
Outstanding Balance
$459,576
Interest Rate
5.27%
Mortgage Type
Stand Alone Refi Refinance Of Original Loan
Estimated Equity
$325,189
Create a Home Valuation Report for This Property
The Home Valuation Report is an in-depth analysis detailing your home's value as well as a comparison with similar homes in the area
Home Values in the Area
Average Home Value in this Area
Purchase History
| Date | Buyer | Sale Price | Title Company |
|---|---|---|---|
| Stauble Shari L | -- | None Available | |
| Stauble Shari L | -- | None Available |
Source: Public Records
Mortgage History
| Date | Status | Borrower | Loan Amount |
|---|---|---|---|
| Open | Stauble Shari L | $483,000 | |
| Closed | Stauble Shari L | $483,000 |
Source: Public Records
Tax History Compared to Growth
Tax History
| Year | Tax Paid | Tax Assessment Tax Assessment Total Assessment is a certain percentage of the fair market value that is determined by local assessors to be the total taxable value of land and additions on the property. | Land | Improvement |
|---|---|---|---|---|
| 2024 | $11,475 | $647,200 | $276,900 | $370,300 |
| 2023 | $10,782 | $647,200 | $276,900 | $370,300 |
| 2022 | $14,607 | $647,200 | $276,900 | $370,300 |
| 2021 | $9,148 | $403,000 | $180,100 | $222,900 |
| 2020 | $9,342 | $403,000 | $180,100 | $222,900 |
| 2019 | $9,309 | $403,000 | $180,100 | $222,900 |
| 2018 | $8,733 | $403,000 | $180,100 | $222,900 |
| 2017 | $8,614 | $372,100 | $155,500 | $216,600 |
| 2016 | $8,718 | $372,100 | $155,500 | $216,600 |
| 2015 | $8,566 | $372,100 | $155,500 | $216,600 |
| 2014 | $8,607 | $372,100 | $155,500 | $216,600 |
| 2013 | $8,491 | $372,100 | $155,500 | $216,600 |
Source: Public Records
Map
Nearby Homes