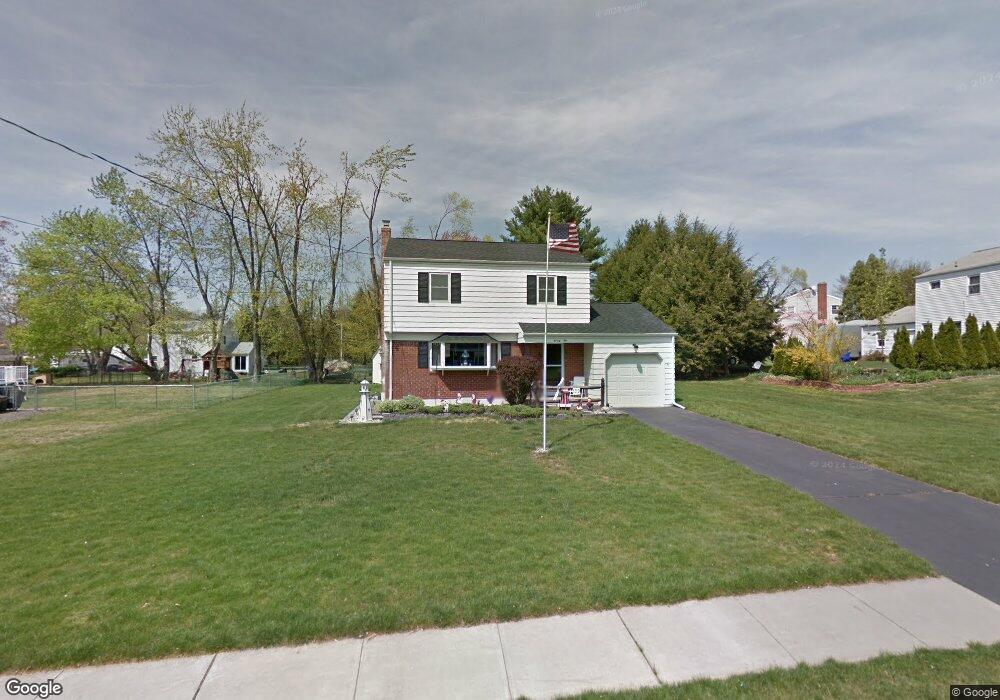
75 Douglas Rd Enfield, CT 06082
Estimated Value: $309,220 - $378,000
3
Beds
2
Baths
1,502
Sq Ft
$224/Sq Ft
Est. Value
About This Home
This home is located at 75 Douglas Rd, Enfield, CT 06082 and is currently estimated at $336,555, approximately $224 per square foot. 75 Douglas Rd is a home located in Hartford County with nearby schools including Nathan Hale Elementary School, Eli Whitney Elementary School, and Enfield High School.
Ownership History
Date
Name
Owned For
Owner Type
Purchase Details
Closed on
Oct 25, 2023
Sold by
R E & E M Hallenbeck Ret and Hallenbeck
Bought by
The Hallenbeck Lt
Current Estimated Value
Purchase Details
Closed on
Oct 21, 2023
Sold by
Hallenbeck Barry J
Bought by
The Hallenbeck Lt
Purchase Details
Closed on
Oct 20, 2023
Sold by
Hallenbeck Barry J
Bought by
The Hallenbeck Lt
Create a Home Valuation Report for This Property
The Home Valuation Report is an in-depth analysis detailing your home's value as well as a comparison with similar homes in the area
Home Values in the Area
Average Home Value in this Area
Purchase History
| Date | Buyer | Sale Price | Title Company |
|---|---|---|---|
| The Hallenbeck Lt | -- | None Available | |
| The Hallenbeck Lt | -- | None Available | |
| The Hallenbeck Lt | -- | None Available |
Source: Public Records
Tax History
| Year | Tax Paid | Tax Assessment Tax Assessment Total Assessment is a certain percentage of the fair market value that is determined by local assessors to be the total taxable value of land and additions on the property. | Land | Improvement |
|---|---|---|---|---|
| 2025 | $5,335 | $152,000 | $57,700 | $94,300 |
| 2024 | $5,139 | $152,000 | $57,700 | $94,300 |
| 2023 | $5,101 | $152,000 | $57,700 | $94,300 |
| 2022 | $4,695 | $152,000 | $57,700 | $94,300 |
| 2021 | $4,543 | $120,920 | $47,800 | $73,120 |
| 2020 | $4,513 | $120,920 | $47,800 | $73,120 |
| 2019 | $4,507 | $120,920 | $47,800 | $73,120 |
| 2018 | $4,386 | $120,920 | $47,800 | $73,120 |
| 2017 | $4,121 | $120,920 | $47,800 | $73,120 |
| 2016 | $4,134 | $123,920 | $49,040 | $74,880 |
| 2015 | $4,008 | $123,920 | $49,040 | $74,880 |
| 2014 | $3,907 | $123,920 | $49,040 | $74,880 |
Source: Public Records
Map
Nearby Homes
Your Personal Tour Guide
Ask me questions while you tour the home.