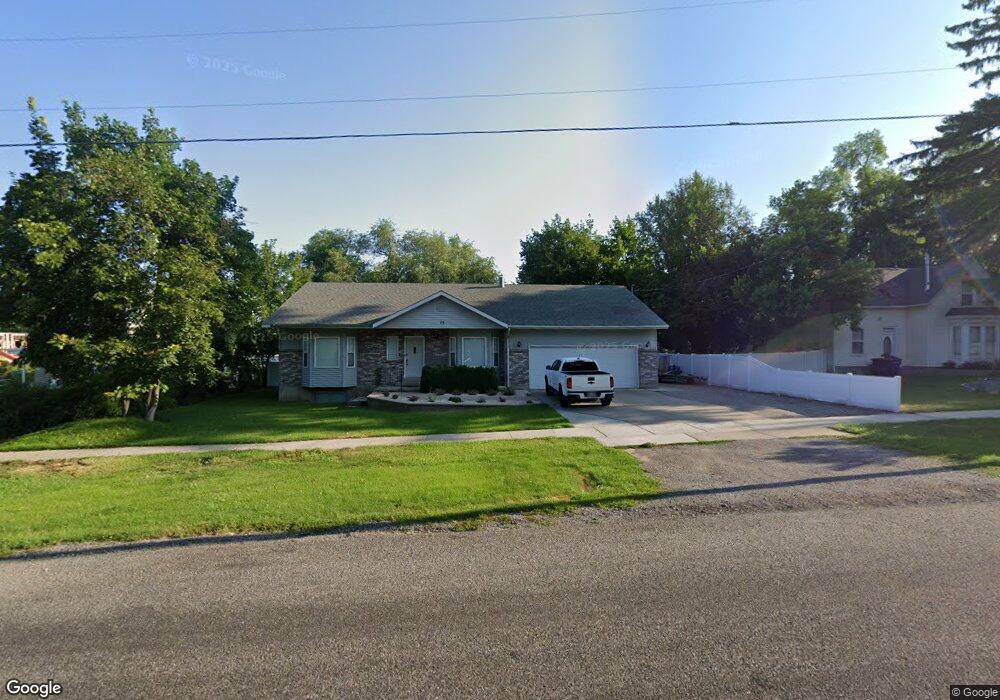
75 E 100 S Providence, UT 84332
Estimated Value: $478,000 - $593,000
2
Beds
4
Baths
1,500
Sq Ft
$351/Sq Ft
Est. Value
About This Home
This home is located at 75 E 100 S, Providence, UT 84332 and is currently estimated at $526,652, approximately $351 per square foot. 75 E 100 S is a home located in Cache County with nearby schools including Providence School, Spring Creek Middle School, and South Cache Middle School.
Ownership History
Date
Name
Owned For
Owner Type
Purchase Details
Closed on
Mar 3, 2022
Sold by
Wallace Olsen Family Trust
Bought by
Smith Jayden and Vogelsberg Brooklyn
Current Estimated Value
Home Financials for this Owner
Home Financials are based on the most recent Mortgage that was taken out on this home.
Original Mortgage
$482,600
Outstanding Balance
$449,284
Interest Rate
3.92%
Mortgage Type
New Conventional
Estimated Equity
$77,368
Purchase Details
Closed on
Oct 19, 2021
Sold by
Brent Hoggan L
Bought by
Wallace Olsen Family Revocable Trust
Create a Home Valuation Report for This Property
The Home Valuation Report is an in-depth analysis detailing your home's value as well as a comparison with similar homes in the area
Home Values in the Area
Average Home Value in this Area
Purchase History
| Date | Buyer | Sale Price | Title Company |
|---|---|---|---|
| Smith Jayden | -- | Cache Title | |
| Wallace Olsen Family Revocable Trust | -- | -- |
Source: Public Records
Mortgage History
| Date | Status | Borrower | Loan Amount |
|---|---|---|---|
| Open | Smith Jayden | $482,600 |
Source: Public Records
Tax History
| Year | Tax Paid | Tax Assessment Tax Assessment Total Assessment is a certain percentage of the fair market value that is determined by local assessors to be the total taxable value of land and additions on the property. | Land | Improvement |
|---|---|---|---|---|
| 2025 | $2,051 | $287,590 | $0 | $0 |
| 2024 | $2,211 | $288,380 | $0 | $0 |
| 2023 | $2,335 | $286,905 | $0 | $0 |
| 2022 | $2,401 | $278,655 | $0 | $0 |
| 2021 | $1,911 | $339,760 | $55,000 | $284,760 |
| 2020 | $1,627 | $268,406 | $55,000 | $213,406 |
| 2019 | $1,719 | $268,405 | $55,000 | $213,405 |
| 2018 | $1,509 | $240,570 | $55,000 | $185,570 |
| 2017 | $1,393 | $117,535 | $0 | $0 |
| 2016 | $1,408 | $117,535 | $0 | $0 |
| 2015 | $1,192 | $99,255 | $0 | $0 |
| 2014 | $1,163 | $99,255 | $0 | $0 |
| 2013 | -- | $99,255 | $0 | $0 |
Source: Public Records
Map
Nearby Homes
Your Personal Tour Guide
Ask me questions while you tour the home.