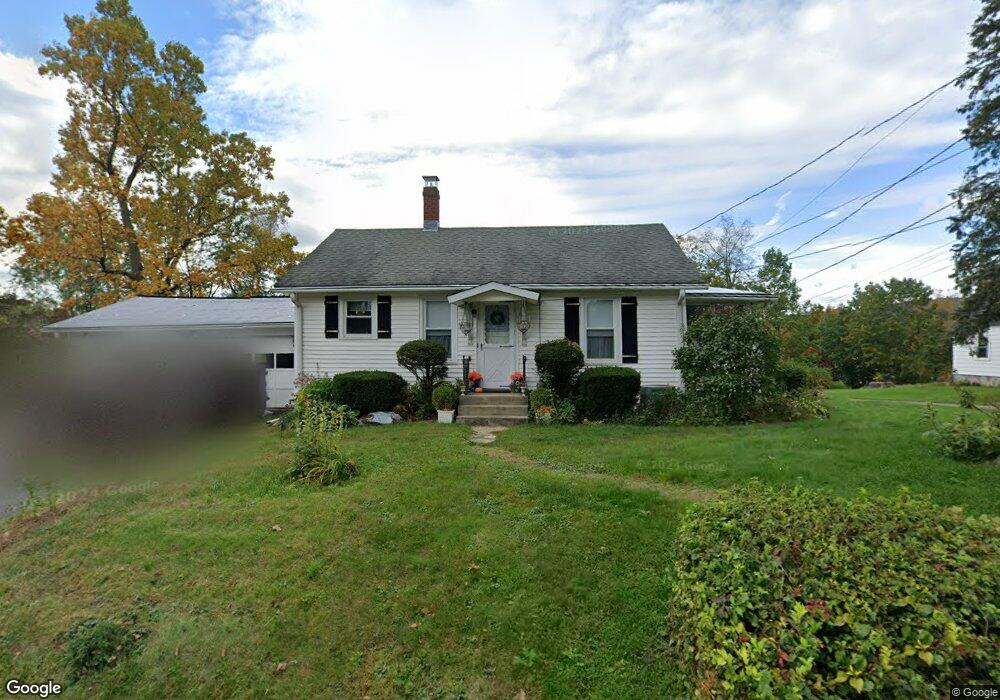
75 E Lake St Winchester Center, CT 06098
Estimated Value: $149,000 - $496,000
1
Bed
1
Bath
690
Sq Ft
$398/Sq Ft
Est. Value
About This Home
This home is located at 75 E Lake St, Winchester Center, CT 06098 and is currently estimated at $274,769, approximately $398 per square foot. 75 E Lake St is a home located in Litchfield County with nearby schools including Pearson School, Explorations Charter School, and St Anthony School.
Ownership History
Date
Name
Owned For
Owner Type
Purchase Details
Closed on
May 8, 2008
Sold by
Soldan Crystal D and Kent Jeanne A
Bought by
Barry Lisa
Current Estimated Value
Home Financials for this Owner
Home Financials are based on the most recent Mortgage that was taken out on this home.
Original Mortgage
$100,000
Outstanding Balance
$63,495
Interest Rate
5.93%
Estimated Equity
$211,274
Create a Home Valuation Report for This Property
The Home Valuation Report is an in-depth analysis detailing your home's value as well as a comparison with similar homes in the area
Home Values in the Area
Average Home Value in this Area
Purchase History
| Date | Buyer | Sale Price | Title Company |
|---|---|---|---|
| Barry Lisa | $100,000 | -- | |
| Berry Lisa | $135,000 | -- | |
| Barry Lisa | $100,000 | -- |
Source: Public Records
Mortgage History
| Date | Status | Borrower | Loan Amount |
|---|---|---|---|
| Open | Barry Lisa | $100,000 | |
| Closed | Barry Lisa | $75,000 | |
| Closed | Barry Lisa | $100,000 |
Source: Public Records
Tax History
| Year | Tax Paid | Tax Assessment Tax Assessment Total Assessment is a certain percentage of the fair market value that is determined by local assessors to be the total taxable value of land and additions on the property. | Land | Improvement |
|---|---|---|---|---|
| 2025 | $3,394 | $116,340 | $39,760 | $76,580 |
| 2024 | $3,169 | $116,340 | $39,760 | $76,580 |
| 2023 | $3,070 | $116,340 | $39,760 | $76,580 |
| 2022 | $2,752 | $82,040 | $28,840 | $53,200 |
| 2021 | $2,752 | $82,040 | $28,840 | $53,200 |
| 2020 | $2,752 | $82,040 | $28,840 | $53,200 |
| 2019 | $2,752 | $82,040 | $28,840 | $53,200 |
| 2018 | $2,752 | $82,040 | $28,840 | $53,200 |
| 2017 | $2,730 | $81,410 | $28,840 | $52,570 |
| 2016 | $2,730 | $81,410 | $28,840 | $52,570 |
| 2015 | $2,662 | $81,410 | $28,840 | $52,570 |
| 2014 | $2,598 | $81,410 | $28,840 | $52,570 |
Source: Public Records
Map
Nearby Homes
Your Personal Tour Guide
Ask me questions while you tour the home.