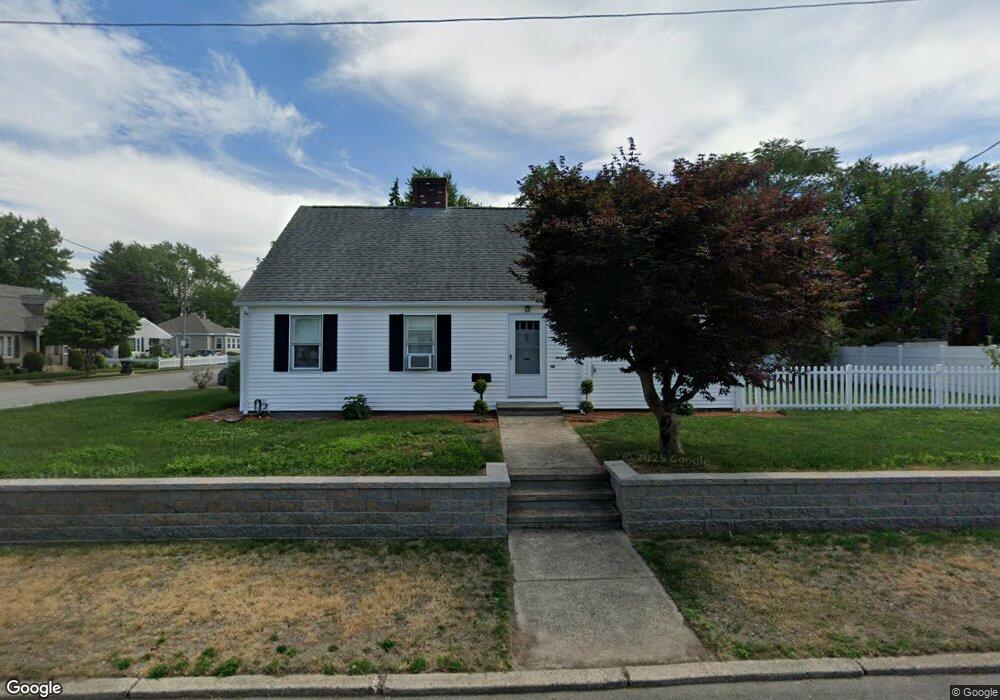
75 Federal St Pawtucket, RI 02861
Darlington NeighborhoodEstimated Value: $442,858 - $494,000
4
Beds
2
Baths
2,080
Sq Ft
$222/Sq Ft
Est. Value
About This Home
This home is located at 75 Federal St, Pawtucket, RI 02861 and is currently estimated at $462,715, approximately $222 per square foot. 75 Federal St is a home located in Providence County with nearby schools including Saint Teresa Catholic Elementary School and St Cecilia School.
Ownership History
Date
Name
Owned For
Owner Type
Purchase Details
Closed on
Oct 2, 2025
Sold by
Petrarca James A and Petrarca Robin A
Bought by
Petrarca Ft and Perarca
Current Estimated Value
Purchase Details
Closed on
Nov 12, 1999
Sold by
Riberro Francisco A and Riberro Maria J
Bought by
Petrarca James A and Petrarca Robin A
Create a Home Valuation Report for This Property
The Home Valuation Report is an in-depth analysis detailing your home's value as well as a comparison with similar homes in the area
Home Values in the Area
Average Home Value in this Area
Purchase History
| Date | Buyer | Sale Price | Title Company |
|---|---|---|---|
| Petrarca Ft | -- | -- | |
| Petrarca James A | $125,000 | -- |
Source: Public Records
Mortgage History
| Date | Status | Borrower | Loan Amount |
|---|---|---|---|
| Previous Owner | Petrarca James A | $165,500 | |
| Previous Owner | Petrarca James A | $175,000 | |
| Previous Owner | Petrarca James A | $50,000 |
Source: Public Records
Tax History Compared to Growth
Tax History
| Year | Tax Paid | Tax Assessment Tax Assessment Total Assessment is a certain percentage of the fair market value that is determined by local assessors to be the total taxable value of land and additions on the property. | Land | Improvement |
|---|---|---|---|---|
| 2025 | $4,253 | $323,400 | $133,200 | $190,200 |
| 2024 | $3,991 | $323,400 | $133,200 | $190,200 |
| 2023 | $4,243 | $250,500 | $89,500 | $161,000 |
| 2022 | $4,153 | $250,500 | $89,500 | $161,000 |
| 2021 | $4,153 | $250,500 | $89,500 | $161,000 |
| 2020 | $4,017 | $192,300 | $74,000 | $118,300 |
| 2019 | $4,017 | $192,300 | $74,000 | $118,300 |
| 2018 | $3,871 | $192,300 | $74,000 | $118,300 |
| 2017 | $4,074 | $179,300 | $68,700 | $110,600 |
| 2016 | $3,925 | $179,300 | $68,700 | $110,600 |
| 2015 | $3,925 | $179,300 | $68,700 | $110,600 |
| 2014 | $3,759 | $163,000 | $65,600 | $97,400 |
Source: Public Records
Map
Nearby Homes