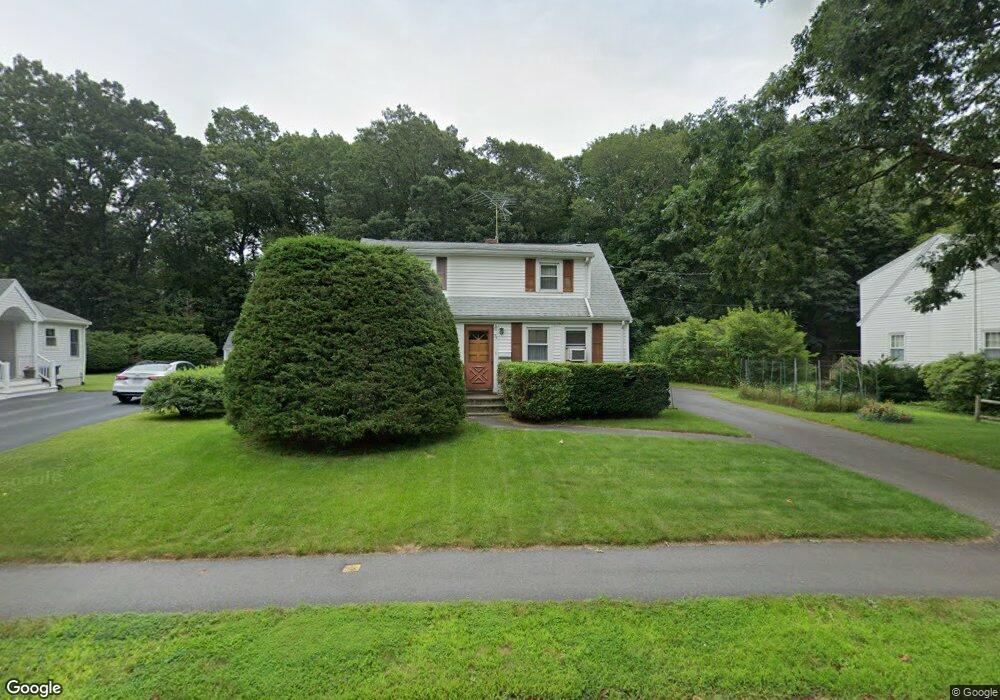
75 Felch Rd Natick, MA 01760
Estimated Value: $787,146 - $946,000
3
Beds
2
Baths
1,584
Sq Ft
$543/Sq Ft
Est. Value
About This Home
This home is located at 75 Felch Rd, Natick, MA 01760 and is currently estimated at $860,787, approximately $543 per square foot. 75 Felch Rd is a home located in Middlesex County with nearby schools including Natick High School, Bennett-Hemenway (Ben-Hem) Elementary School, and Wilson Middle School.
Ownership History
Date
Name
Owned For
Owner Type
Purchase Details
Closed on
Dec 3, 2018
Sold by
Kadlik James S and Kadlik David M
Bought by
Kadlik David M
Current Estimated Value
Home Financials for this Owner
Home Financials are based on the most recent Mortgage that was taken out on this home.
Original Mortgage
$206,000
Outstanding Balance
$160,663
Interest Rate
4.8%
Mortgage Type
New Conventional
Estimated Equity
$700,124
Purchase Details
Closed on
Jun 10, 1997
Sold by
Kadlik Peter
Bought by
Kadlik James S and Kadlik David M
Create a Home Valuation Report for This Property
The Home Valuation Report is an in-depth analysis detailing your home's value as well as a comparison with similar homes in the area
Home Values in the Area
Average Home Value in this Area
Purchase History
| Date | Buyer | Sale Price | Title Company |
|---|---|---|---|
| Kadlik David M | -- | -- | |
| Kadlik James S | $46,666 | -- |
Source: Public Records
Mortgage History
| Date | Status | Borrower | Loan Amount |
|---|---|---|---|
| Open | Kadlik David M | $206,000 |
Source: Public Records
Tax History Compared to Growth
Tax History
| Year | Tax Paid | Tax Assessment Tax Assessment Total Assessment is a certain percentage of the fair market value that is determined by local assessors to be the total taxable value of land and additions on the property. | Land | Improvement |
|---|---|---|---|---|
| 2025 | $7,633 | $638,200 | $426,000 | $212,200 |
| 2024 | $7,410 | $604,400 | $401,000 | $203,400 |
| 2023 | $7,367 | $582,800 | $385,900 | $196,900 |
| 2022 | $7,164 | $537,000 | $350,700 | $186,300 |
| 2021 | $6,878 | $505,400 | $330,700 | $174,700 |
| 2020 | $6,673 | $490,300 | $315,600 | $174,700 |
| 2019 | $6,232 | $490,300 | $315,600 | $174,700 |
| 2018 | $6,008 | $460,400 | $300,600 | $159,800 |
| 2017 | $5,566 | $412,600 | $255,700 | $156,900 |
| 2016 | $5,295 | $390,200 | $234,700 | $155,500 |
| 2015 | $5,191 | $375,600 | $234,700 | $140,900 |
Source: Public Records
Map
Nearby Homes