75 Fillmore St Pawtucket, RI 02860
Fairlawn NeighborhoodEstimated Value: $360,552 - $393,000
About This Home
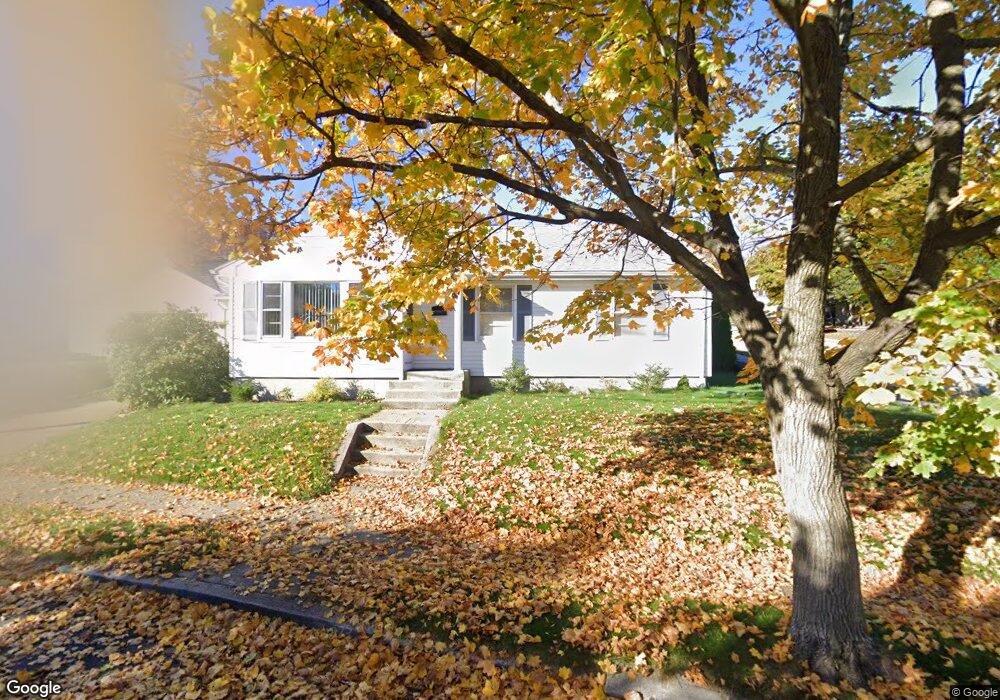
This home is located at 75 Fillmore St, Pawtucket, RI 02860 and is currently estimated at $377,138, approximately $179 per square foot. 75 Fillmore St is a home located in Providence County with nearby schools including The San Miguel School, Bishop Keough Regional High School, and Ocean Tides School.
Ownership History
We collect this data history from publicly available records. To have your information removed, we recommend requesting removal directly through your county’s website.
Purchase Details
Home Financials for this Owner
Home Financials are based on the most recent Mortgage that was taken out on this home.Home Values in the Area
Average Home Value in this Area
Purchase History
We collect this data history from publicly available records. To have your information removed, we recommend requesting removal directly through your county’s website.
| Date | Buyer | Sale Price | Title Company |
|---|---|---|---|
| $125,000 | -- |
Mortgage History
We collect this data history from publicly available records. To have your information removed, we recommend requesting removal directly through your county’s website.
| Date | Status | Borrower | Loan Amount |
|---|---|---|---|
| Open | $122,735 |
Tax History
We collect this data history from publicly available records. To have your information removed, we recommend requesting removal directly through your county’s website.
| Year | Tax Paid | Tax Assessment Tax Assessment Total Assessment is a certain percentage of the fair market value that is determined by local assessors to be the total taxable value of land and additions on the property. | Land | Improvement |
|---|---|---|---|---|
| 2025 | $3,952 | $300,500 | $136,600 | $163,900 |
| 2024 | $3,708 | $300,500 | $136,600 | $163,900 |
| 2023 | $3,432 | $202,600 | $70,100 | $132,500 |
| 2022 | $3,359 | $202,600 | $70,100 | $132,500 |
| 2021 | $3,359 | $202,600 | $70,100 | $132,500 |
| 2020 | $3,470 | $166,100 | $67,500 | $98,600 |
| 2019 | $3,470 | $166,100 | $67,500 | $98,600 |
| 2018 | $3,344 | $166,100 | $67,500 | $98,600 |
| 2017 | $3,097 | $136,300 | $52,700 | $83,600 |
| 2016 | $2,984 | $136,300 | $52,700 | $83,600 |
| 2015 | $2,984 | $136,300 | $52,700 | $83,600 |
| 2014 | $2,979 | $129,200 | $58,600 | $70,600 |
Map
- 216 Toledo Ave
- 0 Piave St
- 21 Milano St
- 53 Christopher St
- 62 Hillcrest Ave
- 25 Christopher St
- 16 Brown St
- 49 Jane St
- 65 Hillcrest Ave
- 27 Hillcrest Ave
- 116 Volturno St
- 294 Smithfield Ave
- 300 Smithfield Ave Unit P2-17
- 10 Josephine St Unit 205
- 20 Hurdis St Unit 18
- 20 Hurdis St Unit 1
- 37 Hampton St
- 290 W Forest Ave
- 21 Urban Ave
- 14 Raphael Ave
Ask me questions while you tour the home.