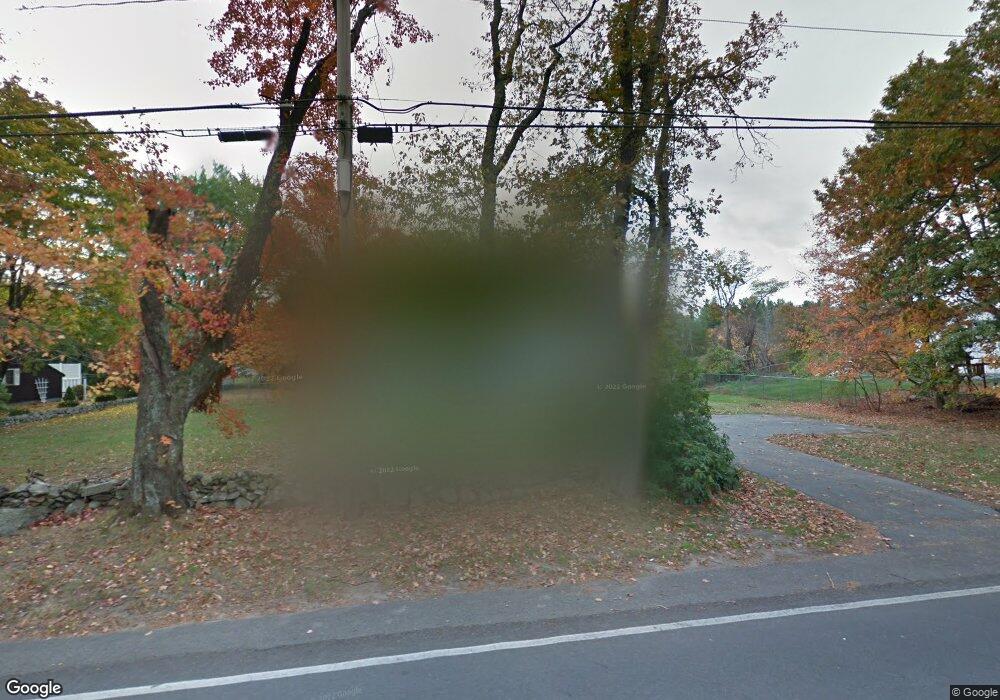
75 Forrest St Plaistow, NH 03865
Estimated Value: $442,000 - $515,000
3
Beds
1
Bath
984
Sq Ft
$486/Sq Ft
Est. Value
About This Home
This home is located at 75 Forrest St, Plaistow, NH 03865 and is currently estimated at $478,091, approximately $485 per square foot. 75 Forrest St is a home with nearby schools including Pollard Elementary School, Timberlane Regional Middle School, and Timberlane Regional High School.
Ownership History
Date
Name
Owned For
Owner Type
Purchase Details
Closed on
Dec 14, 2017
Sold by
Huff Dianna J
Bought by
Dianna J Huff Ret
Current Estimated Value
Purchase Details
Closed on
Jun 20, 2008
Sold by
Alavosus Timothy J
Bought by
Huff Dianna J
Home Financials for this Owner
Home Financials are based on the most recent Mortgage that was taken out on this home.
Original Mortgage
$231,369
Interest Rate
6.1%
Mortgage Type
Purchase Money Mortgage
Purchase Details
Closed on
Jul 18, 2001
Sold by
Maclennan Arthur R and Maclennan Alice A
Bought by
Alavosus Timothy J
Home Financials for this Owner
Home Financials are based on the most recent Mortgage that was taken out on this home.
Original Mortgage
$178,125
Interest Rate
7.2%
Create a Home Valuation Report for This Property
The Home Valuation Report is an in-depth analysis detailing your home's value as well as a comparison with similar homes in the area
Home Values in the Area
Average Home Value in this Area
Purchase History
| Date | Buyer | Sale Price | Title Company |
|---|---|---|---|
| Dianna J Huff Ret | -- | -- | |
| Huff Dianna J | $235,000 | -- | |
| Alavosus Timothy J | $187,500 | -- |
Source: Public Records
Mortgage History
| Date | Status | Borrower | Loan Amount |
|---|---|---|---|
| Previous Owner | Alavosus Timothy J | $223,766 | |
| Previous Owner | Alavosus Timothy J | $234,839 | |
| Previous Owner | Alavosus Timothy J | $231,369 | |
| Previous Owner | Alavosus Timothy J | $178,125 |
Source: Public Records
Tax History Compared to Growth
Tax History
| Year | Tax Paid | Tax Assessment Tax Assessment Total Assessment is a certain percentage of the fair market value that is determined by local assessors to be the total taxable value of land and additions on the property. | Land | Improvement |
|---|---|---|---|---|
| 2024 | $5,661 | $273,200 | $134,900 | $138,300 |
| 2023 | $6,103 | $273,200 | $134,900 | $138,300 |
| 2022 | $5,194 | $273,200 | $134,900 | $138,300 |
| 2021 | $5,180 | $273,200 | $134,900 | $138,300 |
| 2020 | $4,861 | $224,540 | $94,240 | $130,300 |
| 2019 | $4,785 | $224,540 | $94,240 | $130,300 |
| 2018 | $4,786 | $194,640 | $94,240 | $100,400 |
| 2017 | $4,664 | $194,640 | $94,240 | $100,400 |
| 2016 | $4,535 | $201,540 | $94,240 | $107,300 |
| 2015 | $4,656 | $192,710 | $101,110 | $91,600 |
| 2014 | $4,506 | $179,300 | $97,200 | $82,100 |
| 2011 | $4,431 | $179,300 | $97,200 | $82,100 |
Source: Public Records
Map
Nearby Homes
- 15 Autumn Cir Unit A
- 15 Autumn Cir Unit B
- 15 Canterbury Forest Unit B
- 115 Forrest St
- 16 Forrest St
- 58 Main St
- 440 North Ave Unit 145
- 440 North Ave Unit 122
- 440 North Ave Unit 173
- 440 North Ave Unit 186
- 63 Pollard Rd
- 38 Brickett Hill Cir Unit 38
- 48 Newton Rd
- 7 Squaw Creek Dr
- 8 Iris Way Unit 8
- 15 Iris Way Unit 27
- 15 W Pine St
- 119 Brickett Hill Cir Unit 119
- 175 Brickett Hill Cir Unit 175
- 207 Oak Ridge Rd
- 77 Forrest St
- 29 Autumn Cir
- 73 Forrest St
- 27 Autumn Cir
- 68 Forrest St Unit 8B
- 64 Forrest St
- 71 Forrest St
- 31 Torrey Pines Cir Unit 11
- 5 Torrey Pines Cir Unit lot 20
- 29 Torrey Pines Cir Unit 29
- 3 Torrey Pines Cir Unit lot 21
- 31 Torrey Pines Cir Unit 31
- 31 Torrey Pines Cir Unit lot 11
- 31 Torrey Pines Cir Unit 31
- 14 Torrey Pines Cir Unit 31
- 18 Torrey Pines Cir
- 14 Torrey Pines Cir Unit lot 31
- 18 Autumn Cir
- 25 Autumn Cir
- 20 Autumn Cir