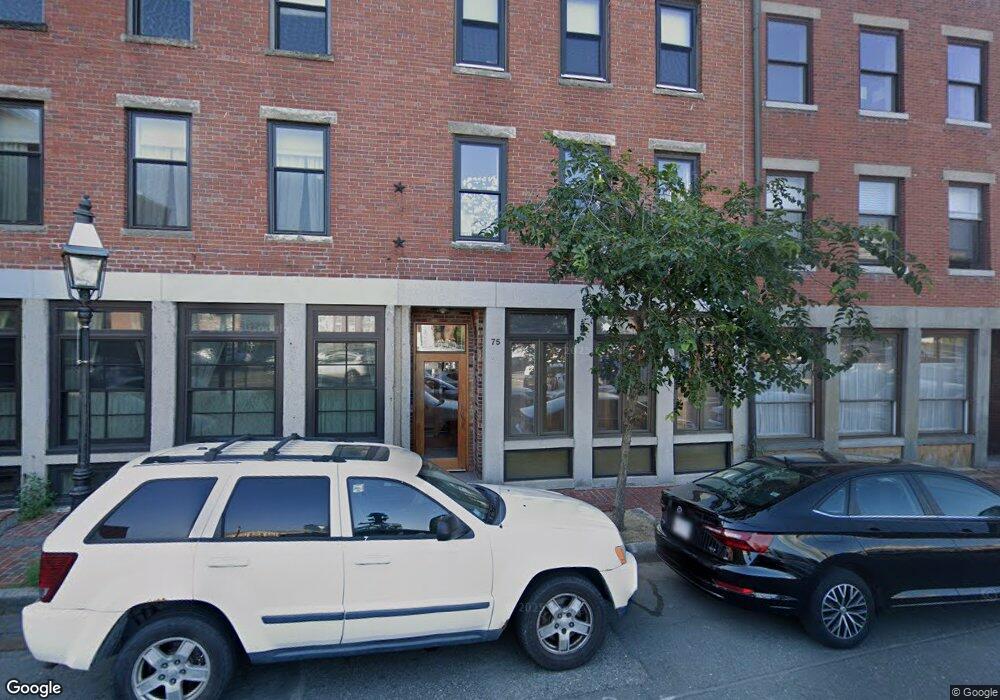
75 Fulton St Unit 61 Boston, MA 02109
North End NeighborhoodEstimated Value: $1,258,000 - $1,389,162
2
Beds
2
Baths
1,115
Sq Ft
$1,198/Sq Ft
Est. Value
About This Home
This home is located at 75 Fulton St Unit 61, Boston, MA 02109 and is currently estimated at $1,335,291, approximately $1,197 per square foot. 75 Fulton St Unit 61 is a home located in Suffolk County with nearby schools including St John School, Boston Children's School, and Torit Montessori School.
Ownership History
Date
Name
Owned For
Owner Type
Purchase Details
Closed on
Sep 30, 2021
Sold by
Katherine E Whidden T
Bought by
Frances-Cassidy Barbara and Koch Christopher R
Current Estimated Value
Home Financials for this Owner
Home Financials are based on the most recent Mortgage that was taken out on this home.
Original Mortgage
$927,200
Outstanding Balance
$841,776
Interest Rate
2.5%
Mortgage Type
Purchase Money Mortgage
Estimated Equity
$493,515
Purchase Details
Closed on
Sep 13, 2019
Sold by
Whidden Katherine
Bought by
Katherine Whidden T
Purchase Details
Closed on
Dec 2, 1993
Sold by
Foti Paul
Bought by
Whidden Katherine E
Purchase Details
Closed on
Apr 29, 1988
Sold by
Sterite Tr Jeanne
Bought by
Foti Paul S
Create a Home Valuation Report for This Property
The Home Valuation Report is an in-depth analysis detailing your home's value as well as a comparison with similar homes in the area
Home Values in the Area
Average Home Value in this Area
Purchase History
| Date | Buyer | Sale Price | Title Company |
|---|---|---|---|
| Frances-Cassidy Barbara | $1,159,000 | None Available | |
| Katherine Whidden T | -- | -- | |
| Whidden Katherine E | $235,000 | -- | |
| Foti Paul S | $225,000 | -- |
Source: Public Records
Mortgage History
| Date | Status | Borrower | Loan Amount |
|---|---|---|---|
| Open | Frances-Cassidy Barbara | $927,200 | |
| Previous Owner | Foti Paul S | $275,000 | |
| Previous Owner | Foti Paul S | $75,000 | |
| Previous Owner | Foti Paul S | $41,700 |
Source: Public Records
Tax History Compared to Growth
Tax History
| Year | Tax Paid | Tax Assessment Tax Assessment Total Assessment is a certain percentage of the fair market value that is determined by local assessors to be the total taxable value of land and additions on the property. | Land | Improvement |
|---|---|---|---|---|
| 2025 | $13,903 | $1,200,600 | $0 | $1,200,600 |
| 2024 | $12,894 | $1,182,900 | $0 | $1,182,900 |
| 2023 | $12,347 | $1,149,600 | $0 | $1,149,600 |
| 2022 | $9,597 | $882,100 | $0 | $882,100 |
| 2021 | $9,412 | $882,100 | $0 | $882,100 |
| 2020 | $9,520 | $901,500 | $0 | $901,500 |
| 2019 | $8,551 | $811,335 | $0 | $811,335 |
| 2018 | $8,098 | $772,700 | $0 | $772,700 |
| 2017 | $7,945 | $750,225 | $0 | $750,225 |
| 2016 | $7,860 | $714,500 | $0 | $714,500 |
| 2015 | $8,225 | $679,200 | $0 | $679,200 |
| 2014 | $7,684 | $610,800 | $0 | $610,800 |
Source: Public Records
Map
Nearby Homes
- 110-112 Commercial St Unit 2
- 110-112 Commercial St Unit 5
- 142 Commercial St Unit 503
- 170 Commercial St Unit 4
- 120 Fulton St Unit DE
- 120 Fulton St Unit 5 C&D
- 122-130 Fulton Unit 13
- 130 Fulton St Unit 16
- 63 Atlantic Ave Unit 9B
- 63 Atlantic Ave Unit 7E
- 220 Commercial St Unit 5A
- 290 North St Unit 4
- 1 Lewis Wharf
- 59 Commercial Wharf Unit 1
- 21 Moon St Unit 2
- 28 Atlantic Ave Unit 638
- 28 Atlantic Ave Unit 424
- 28 Atlantic Ave Unit 534
- 115 Salem St Unit 16
- 11 Wiget St Unit 11-4
- 75 Fulton St Unit 62
- 75 Fulton St Unit 52
- 75 Fulton St Unit 51
- 75 Fulton St Unit 42
- 75 Fulton St Unit 41
- 75 Fulton St Unit 32
- 75 Fulton St Unit 31
- 75 Fulton St Unit 22
- 75 Fulton St Unit 21
- 75 Fulton St Unit 14
- 75 Fulton St Unit 12
- 75 Fulton St Unit 11
- 75 Fulton St Unit 1
- 65-67 Fulton St Unit 4
- 65-67 Fulton St Unit 3
- 65 Fulton St Unit 4
- 77 Fulton St Unit Two
- 77 Fulton St Unit Four
- 77 Fulton St Unit Suite 1
- 77 Fulton St Unit Suite 4