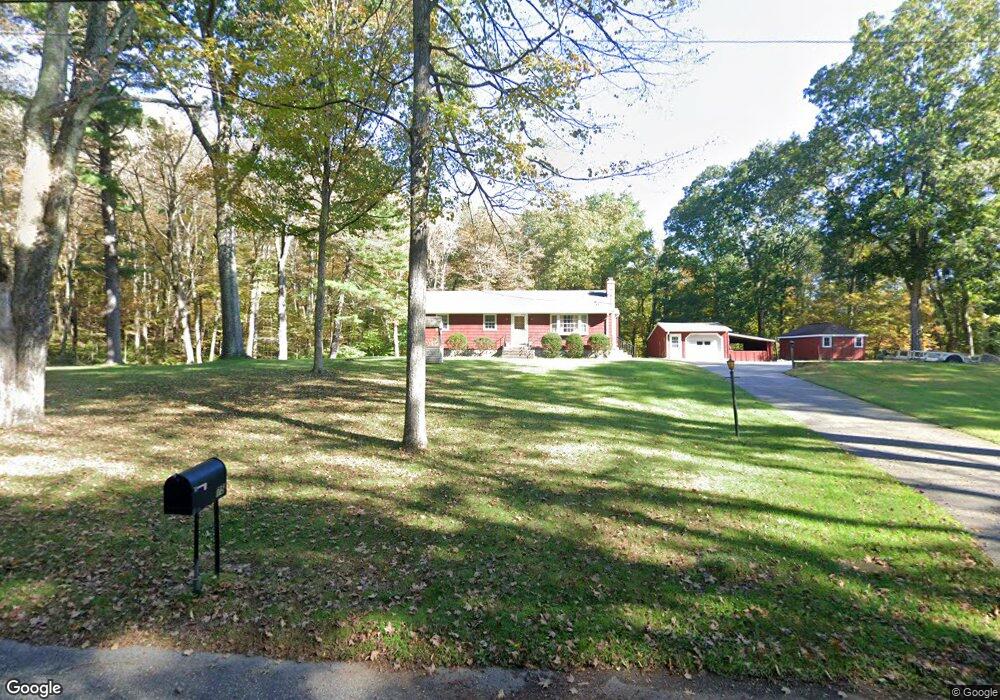
75 Johnson Rd Columbia, CT 06237
Estimated Value: $278,000 - $384,000
3
Beds
3
Baths
1,170
Sq Ft
$284/Sq Ft
Est. Value
About This Home
This home is located at 75 Johnson Rd, Columbia, CT 06237 and is currently estimated at $332,266, approximately $283 per square foot. 75 Johnson Rd is a home located in Tolland County with nearby schools including Horace W. Porter School and St Mary St Joseph School.
Ownership History
Date
Name
Owned For
Owner Type
Purchase Details
Closed on
Oct 28, 2024
Sold by
Clark Eugene F
Bought by
Welch Bonnie C
Current Estimated Value
Purchase Details
Closed on
Oct 17, 2024
Sold by
Clark Eugene F
Bought by
Welch Bonnie C
Purchase Details
Closed on
Apr 22, 1980
Bought by
Clark Eugene F M
Create a Home Valuation Report for This Property
The Home Valuation Report is an in-depth analysis detailing your home's value as well as a comparison with similar homes in the area
Home Values in the Area
Average Home Value in this Area
Purchase History
| Date | Buyer | Sale Price | Title Company |
|---|---|---|---|
| Welch Bonnie C | -- | None Available | |
| Welch Bonnie C | -- | None Available | |
| Welch Bonnie C | -- | None Available | |
| Welch Bonnie C | -- | None Available | |
| Clark Eugene F M | -- | -- |
Source: Public Records
Mortgage History
| Date | Status | Borrower | Loan Amount |
|---|---|---|---|
| Previous Owner | Clark Eugene F M | $26,800 |
Source: Public Records
Tax History
| Year | Tax Paid | Tax Assessment Tax Assessment Total Assessment is a certain percentage of the fair market value that is determined by local assessors to be the total taxable value of land and additions on the property. | Land | Improvement |
|---|---|---|---|---|
| 2025 | $3,954 | $135,100 | $39,970 | $95,130 |
| 2024 | $3,799 | $135,100 | $39,970 | $95,130 |
| 2023 | $3,500 | $135,100 | $39,970 | $95,130 |
| 2022 | $3,495 | $135,100 | $39,970 | $95,130 |
| 2021 | $3,616 | $123,300 | $39,900 | $83,400 |
| 2020 | $3,616 | $123,300 | $39,900 | $83,400 |
| 2019 | $3,587 | $122,300 | $39,900 | $82,400 |
| 2018 | $3,514 | $119,800 | $39,900 | $79,900 |
| 2017 | $3,460 | $119,800 | $39,900 | $79,900 |
| 2016 | $3,323 | $121,100 | $39,900 | $81,200 |
| 2015 | $3,237 | $119,300 | $39,900 | $79,400 |
| 2014 | $3,237 | $119,300 | $39,900 | $79,400 |
Source: Public Records
Map
Nearby Homes