


75 Maple St West Roxbury, MA 02132
West Roxbury Neighborhood
3
Beds
2
Baths
1,850
Sq Ft
8,712
Sq Ft Lot
About This Home
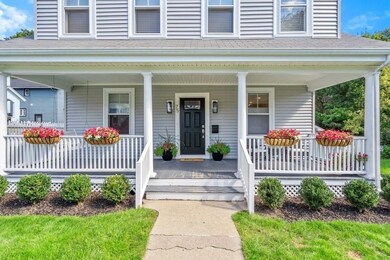
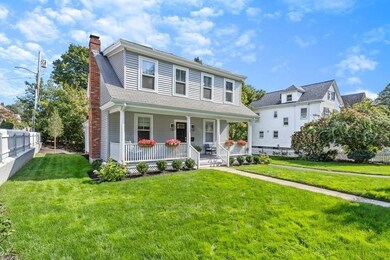
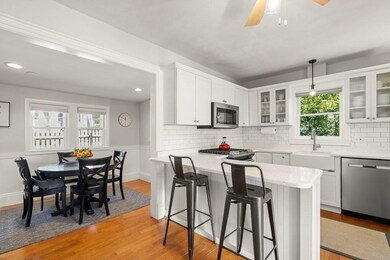
As of January 2022Jewel box single family in a most desirable West Roxbury neighborhood! A white picket fence welcomes you to this picture perfect Colonial home complete with farmers porch & truly fabulous outdoor spaces. Classic floorplan offering a warm and inviting living room, formal dining w/ decorative fireplace, & sun drenched family/play room. White & bright, recently remodeled eat- in- kitchen w/ quartz counters, stainless appliances, and breakfast bar. A casual dining area off of the kitchen makes for fantastic entertaining flow. Upstairs includes three great sized bedrooms including oversized primary suite with double closets. Laundry on this level plus family bath. Located on a large corner lot, no outdoor space goes unused. A back patio, side playground, and beautifully manicured lawn. Many recent improvements (new siding, new garage door, landscaping and tree work). Special location just minutes to the commuter rail, Centre Street shops and restaurants, parks, Downtown Boston.
Home Details
Home Type
- Single Family
Est. Annual Taxes
- $10,716
Year Built
- 1920
Parking
- 1
Kitchen
- Breakfast Bar
- Kitchen Island
Bedrooms and Bathrooms
- Primary bedroom located on second floor
Ownership History
Date
Name
Owned For
Owner Type
Purchase Details
Listed on
Oct 13, 2021
Closed on
Jan 27, 2022
Sold by
Pinta Ian J and Pinta Jennifer L
Bought by
Lesage Mary E and Benezra Sam E
Seller's Agent
Allison Blank
Compass
Buyer's Agent
Elizabeth Bain
Commonwealth Standard Realty Advisors
Sold Price
$881,500
Total Days on Market
14
Current Estimated Value
Home Financials for this Owner
Home Financials are based on the most recent Mortgage that was taken out on this home.
Estimated Appreciation
$163,234
Avg. Annual Appreciation
4.43%
Original Mortgage
$705,200
Outstanding Balance
$658,652
Interest Rate
3.22%
Mortgage Type
Purchase Money Mortgage
Estimated Equity
$360,064
Purchase Details
Listed on
Sep 13, 2018
Closed on
Nov 8, 2018
Sold by
Kevin Shannon Obrien F
Bought by
Pinta Ian J and Pinta Jennifer L
Seller's Agent
Beacon Group
Coldwell Banker Realty - Newton
Buyer's Agent
Allison Blank
Compass
List Price
$699,900
Sold Price
$785,000
Premium/Discount to List
$85,100
12.16%
Home Financials for this Owner
Home Financials are based on the most recent Mortgage that was taken out on this home.
Avg. Annual Appreciation
3.67%
Original Mortgage
$667,250
Interest Rate
3.75%
Mortgage Type
Unknown
Purchase Details
Closed on
Nov 9, 2015
Sold by
Obrien Kevin M and Obrien Shannon M
Bought by
Obrien Kevin and Obrien Shannon M
Purchase Details
Listed on
Jul 18, 2012
Closed on
Nov 30, 2012
Sold by
Bergerson John and Theran Sally
Bought by
Obrain Kevin M and Obrain Shannon M
Seller's Agent
Alyson Theran
William Raveis R.E. & Home Services
Buyer's Agent
Stephanie Ford
Coldwell Banker Realty - Newton
List Price
$479,900
Sold Price
$412,000
Premium/Discount to List
-$67,900
-14.15%
Home Financials for this Owner
Home Financials are based on the most recent Mortgage that was taken out on this home.
Avg. Annual Appreciation
7.51%
Original Mortgage
$329,600
Interest Rate
3.4%
Mortgage Type
New Conventional
Purchase Details
Closed on
Jan 27, 2005
Sold by
Juliani Lisa M
Bought by
Bergeron John and Theran Sally
Home Financials for this Owner
Home Financials are based on the most recent Mortgage that was taken out on this home.
Original Mortgage
$333,700
Interest Rate
5.67%
Mortgage Type
Purchase Money Mortgage
Purchase Details
Closed on
Jun 23, 2000
Sold by
Duffy Catherine M Est
Bought by
Juliani Lisa M
Home Financials for this Owner
Home Financials are based on the most recent Mortgage that was taken out on this home.
Original Mortgage
$130,000
Interest Rate
8.48%
Mortgage Type
Purchase Money Mortgage
Similar Homes in West Roxbury, MA
Create a Home Valuation Report for This Property
The Home Valuation Report is an in-depth analysis detailing your home's value as well as a comparison with similar homes in the area
Home Values in the Area
Average Home Value in this Area
Purchase History
| Date | Type | Sale Price | Title Company |
|---|---|---|---|
| Not Resolvable | $881,500 | None Available | |
| Not Resolvable | $785,000 | -- | |
| Quit Claim Deed | -- | -- | |
| Not Resolvable | $412,000 | -- | |
| Deed | $431,000 | -- | |
| Deed | $300,000 | -- |
Source: Public Records
Mortgage History
| Date | Status | Loan Amount | Loan Type |
|---|---|---|---|
| Open | $705,200 | Purchase Money Mortgage | |
| Previous Owner | $667,250 | Unknown | |
| Previous Owner | $329,600 | New Conventional | |
| Previous Owner | $333,700 | Purchase Money Mortgage | |
| Previous Owner | $150,000 | No Value Available | |
| Previous Owner | $130,000 | No Value Available | |
| Previous Owner | $130,000 | Purchase Money Mortgage |
Source: Public Records
Property History
| Date | Event | Price | Change | Sq Ft Price |
|---|---|---|---|---|
| 01/27/2022 01/27/22 | Sold | $881,500 | +3.8% | $476 / Sq Ft |
| 10/28/2021 10/28/21 | Pending | -- | -- | -- |
| 10/26/2021 10/26/21 | For Sale | -- | -- | -- |
| 10/19/2021 10/19/21 | Pending | -- | -- | -- |
| 10/13/2021 10/13/21 | For Sale | $849,000 | +8.2% | $459 / Sq Ft |
| 11/08/2018 11/08/18 | Sold | $785,000 | +12.2% | $424 / Sq Ft |
| 09/19/2018 09/19/18 | Pending | -- | -- | -- |
| 09/13/2018 09/13/18 | For Sale | $699,900 | +69.9% | $378 / Sq Ft |
| 11/30/2012 11/30/12 | Sold | $412,000 | -8.4% | $238 / Sq Ft |
| 11/10/2012 11/10/12 | Pending | -- | -- | -- |
| 09/12/2012 09/12/12 | Price Changed | $449,900 | -6.3% | $260 / Sq Ft |
| 07/18/2012 07/18/12 | For Sale | $479,900 | -- | $277 / Sq Ft |
Source: MLS Property Information Network (MLS PIN)
Tax History Compared to Growth
Tax History
| Year | Tax Paid | Tax Assessment Tax Assessment Total Assessment is a certain percentage of the fair market value that is determined by local assessors to be the total taxable value of land and additions on the property. | Land | Improvement |
|---|---|---|---|---|
| 2025 | $10,716 | $925,400 | $296,600 | $628,800 |
| 2024 | $10,260 | $941,300 | $283,000 | $658,300 |
| 2023 | $7,535 | $701,600 | $266,900 | $434,700 |
| 2022 | $6,939 | $637,800 | $242,600 | $395,200 |
| 2021 | $6,369 | $596,900 | $233,300 | $363,600 |
| 2020 | $6,144 | $581,800 | $209,600 | $372,200 |
| 2019 | $5,652 | $536,200 | $181,100 | $355,100 |
| 2018 | $5,405 | $515,700 | $181,100 | $334,600 |
| 2017 | $5,406 | $510,500 | $181,100 | $329,400 |
| 2016 | $5,248 | $477,100 | $181,100 | $296,000 |
| 2015 | $5,296 | $437,300 | $193,800 | $243,500 |
| 2014 | $5,191 | $412,600 | $193,800 | $218,800 |
Source: Public Records
Agents Affiliated with this Home
-
Allison Blank
A
Seller's Agent in 2022
Allison Blank
Compass
(617) 851-2734
2 in this area
113 Total Sales
-
Elizabeth Bain
Buyer's Agent in 2022
Elizabeth Bain
Commonwealth Standard Realty Advisors
(508) 954-1935
4 in this area
233 Total Sales
-
Beacon Group
B
Seller's Agent in 2018
Beacon Group
Coldwell Banker Realty - Newton
(617) 480-5480
1 in this area
108 Total Sales
-
Alyson Theran
Seller's Agent in 2012
Alyson Theran
William Raveis R.E. & Home Services
(617) 797-7321
3 Total Sales
-
Stephanie Ford
S
Buyer's Agent in 2012
Stephanie Ford
Coldwell Banker Realty - Newton
12 Total Sales
Map
Source: MLS Property Information Network (MLS PIN)
MLS Number: 72907621
APN: WROX-000000-000020-006283
Disclaimer: Certain information contained herein is derived from information provided by parties other than Homes.com. All information provided is deemed reliable, but is not guaranteed to be accurate and should be independently verified.
![]() The property listing data and information, or the Images, set forth herein were provided to MLS Property Information Network, Inc. from third party sources, including sellers, lessors and public records, and were compiled by MLS Property Information Network, Inc. The property listing data and information, and the Images, are for the personal, non-commercial use of consumers having a good faith interest in purchasing or leasing listed properties of the type displayed to them and may not be used for any purpose other than to identify prospective properties which such consumers may have a good faith interest in purchasing or leasing. MLS Property Information Network, Inc. and its subscribers disclaim any and all representations and warranties as to the accuracy of the property listing data and information, or as to the accuracy of any of the Images, set forth herein.
The property listing data and information, or the Images, set forth herein were provided to MLS Property Information Network, Inc. from third party sources, including sellers, lessors and public records, and were compiled by MLS Property Information Network, Inc. The property listing data and information, and the Images, are for the personal, non-commercial use of consumers having a good faith interest in purchasing or leasing listed properties of the type displayed to them and may not be used for any purpose other than to identify prospective properties which such consumers may have a good faith interest in purchasing or leasing. MLS Property Information Network, Inc. and its subscribers disclaim any and all representations and warranties as to the accuracy of the property listing data and information, or as to the accuracy of any of the Images, set forth herein.
Nearby Homes
- 52 Garth Rd
- 15 Hodgdon Terrace
- 121-123 Willow St
- 96 Redlands Rd Unit 3
- 125 Redlands Rd Unit 2
- 125 Redlands Rd Unit 1
- 1789 Centre St Unit 205
- 589 Weld St
- 102 Greaton Rd
- 78 Park St
- 131 Russett Rd
- 18 Richwood St
- 92 Westover St
- 17 Sidley Rd
- 80 Mount Vernon St
- 186 Park St
- 1690 Centre St Unit 2
- 25 Addington Rd
- 11 Carlson Cir
- 633 Lagrange St