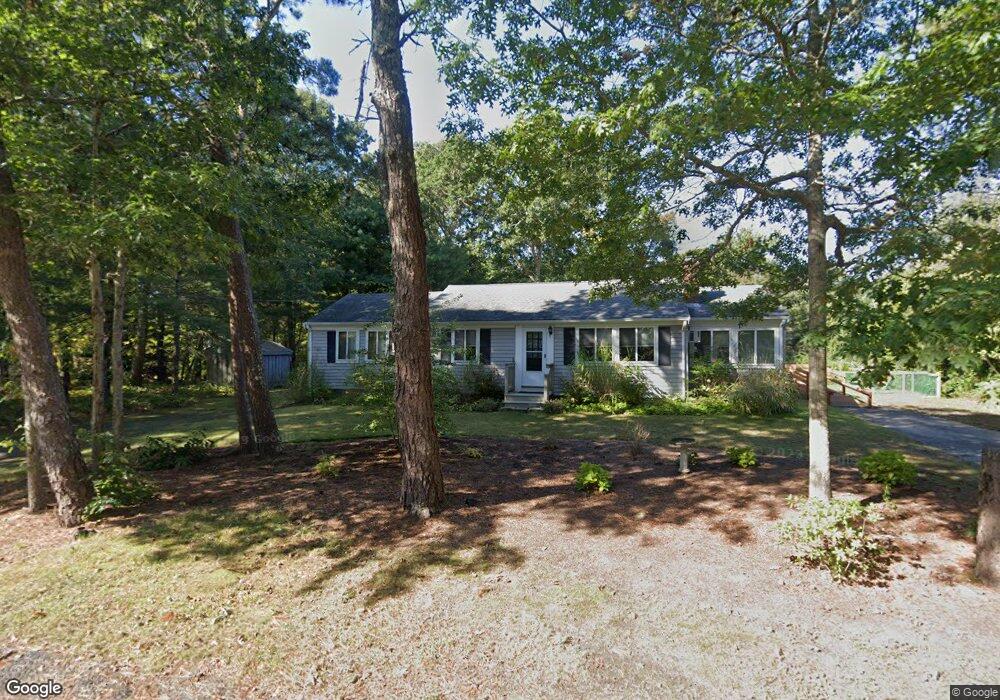
75 Mattachee Rd South Yarmouth, MA 02664
Estimated Value: $671,719 - $700,000
2
Beds
2
Baths
1,488
Sq Ft
$461/Sq Ft
Est. Value
About This Home
This home is located at 75 Mattachee Rd, South Yarmouth, MA 02664 and is currently estimated at $686,430, approximately $461 per square foot. 75 Mattachee Rd is a home located in Barnstable County with nearby schools including Dennis-Yarmouth Regional High School, Sturgis Charter Public School, and St. Pius X. School.
Ownership History
Date
Name
Owned For
Owner Type
Purchase Details
Closed on
Oct 30, 2009
Sold by
Robbins Ft and Robbins Edward E S
Bought by
Padolf Stanley and Padolf Lisa
Current Estimated Value
Home Financials for this Owner
Home Financials are based on the most recent Mortgage that was taken out on this home.
Original Mortgage
$100,000
Outstanding Balance
$65,496
Interest Rate
5.06%
Mortgage Type
Purchase Money Mortgage
Estimated Equity
$620,934
Purchase Details
Closed on
Apr 10, 2008
Sold by
Robbins Carol and Robbins Edward S
Bought by
Robbins Carol and Robbins Edward E S
Purchase Details
Closed on
Oct 1, 2007
Sold by
Pappalardo Antoinette M and Pappalardo John
Bought by
Robbins Carol A and Robbins Edward S
Home Financials for this Owner
Home Financials are based on the most recent Mortgage that was taken out on this home.
Original Mortgage
$271,530
Interest Rate
6.65%
Mortgage Type
Purchase Money Mortgage
Create a Home Valuation Report for This Property
The Home Valuation Report is an in-depth analysis detailing your home's value as well as a comparison with similar homes in the area
Home Values in the Area
Average Home Value in this Area
Purchase History
| Date | Buyer | Sale Price | Title Company |
|---|---|---|---|
| Padolf Stanley | $275,000 | -- | |
| Robbins Carol | -- | -- | |
| Robbins Carol A | $301,700 | -- |
Source: Public Records
Mortgage History
| Date | Status | Borrower | Loan Amount |
|---|---|---|---|
| Open | Padolf Stanley | $100,000 | |
| Previous Owner | Robbins Carol A | $271,530 |
Source: Public Records
Tax History Compared to Growth
Tax History
| Year | Tax Paid | Tax Assessment Tax Assessment Total Assessment is a certain percentage of the fair market value that is determined by local assessors to be the total taxable value of land and additions on the property. | Land | Improvement |
|---|---|---|---|---|
| 2025 | $3,715 | $524,700 | $200,200 | $324,500 |
| 2024 | $3,485 | $472,200 | $174,200 | $298,000 |
| 2023 | $3,374 | $416,000 | $151,500 | $264,500 |
| 2022 | $3,258 | $354,900 | $144,600 | $210,300 |
| 2021 | $3,085 | $322,700 | $144,600 | $178,100 |
| 2020 | $3,120 | $312,000 | $153,200 | $158,800 |
| 2019 | $2,917 | $288,800 | $153,200 | $135,600 |
| 2018 | $2,709 | $263,300 | $127,700 | $135,600 |
| 2017 | $2,619 | $261,400 | $127,700 | $133,700 |
| 2016 | $2,507 | $251,200 | $117,500 | $133,700 |
| 2015 | $2,504 | $249,400 | $112,400 | $137,000 |
Source: Public Records
Map
Nearby Homes
- 55 Aspinet Rd
- 21 Lyndale Rd
- 8 Holly Ln
- 16 Peregrine Ln
- 26 Howes Rd
- 31 Gardiner Ln
- 55 Pawkannawkut Dr
- 27 Wilfin Rd
- 8 Rogers Ave
- 135 S Shore Dr Unit 17
- 135 S South Shore Dr Unit 17
- 69 Pine Grove Rd
- 844 Route 28 Unit 1C
- 844 Route 28 Unit 1C
- 844 Route 28 Unit 9B
- 30 Nauset Ln
- 9 Cedar St
- 4 Braddock St
- 19 Anthony Rd
- 89 Acres Ave