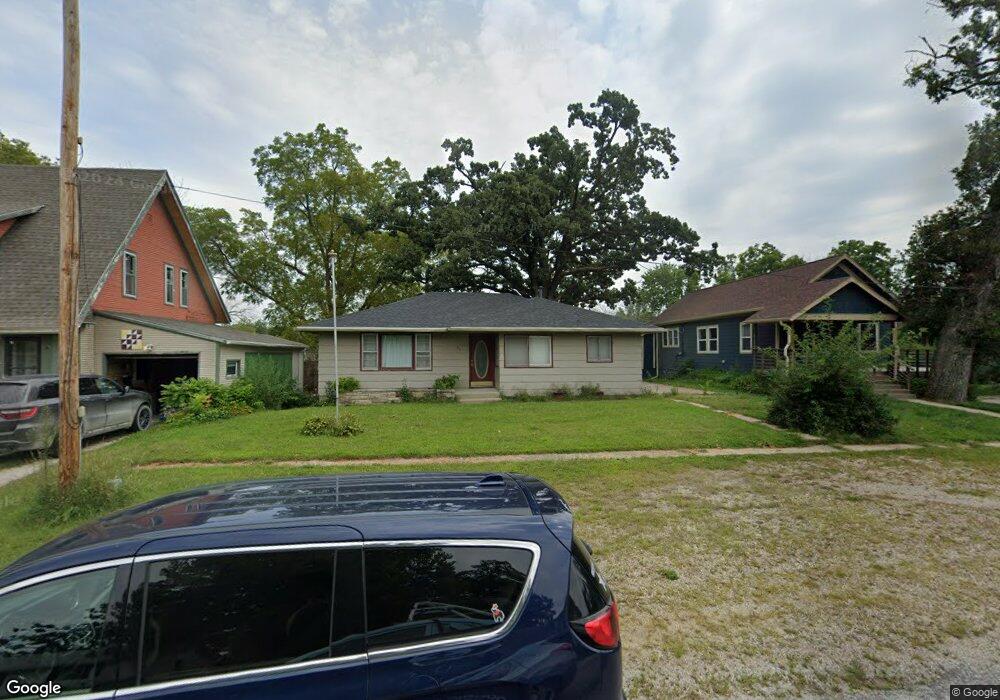
75 Metcalf St Maxwell, IA 50161
Estimated Value: $153,000 - $195,000
3
Beds
1
Bath
1,192
Sq Ft
$146/Sq Ft
Est. Value
About This Home
This home is located at 75 Metcalf St, Maxwell, IA 50161 and is currently estimated at $173,440, approximately $145 per square foot. 75 Metcalf St is a home located in Story County with nearby schools including Collins-Maxwell Elementary School and Collins-Maxwell Middle/High School.
Ownership History
Date
Name
Owned For
Owner Type
Purchase Details
Closed on
Nov 9, 2017
Sold by
Nees Anthony S and Ness Jamie D
Bought by
Briggs Bryce
Current Estimated Value
Home Financials for this Owner
Home Financials are based on the most recent Mortgage that was taken out on this home.
Original Mortgage
$98,188
Outstanding Balance
$82,342
Interest Rate
3.88%
Mortgage Type
FHA
Estimated Equity
$91,098
Create a Home Valuation Report for This Property
The Home Valuation Report is an in-depth analysis detailing your home's value as well as a comparison with similar homes in the area
Purchase History
| Date | Buyer | Sale Price | Title Company |
|---|---|---|---|
| Briggs Bryce | $100,000 | None Available |
Source: Public Records
Mortgage History
| Date | Status | Borrower | Loan Amount |
|---|---|---|---|
| Open | Briggs Bryce | $98,188 |
Source: Public Records
Tax History
| Year | Tax Paid | Tax Assessment Tax Assessment Total Assessment is a certain percentage of the fair market value that is determined by local assessors to be the total taxable value of land and additions on the property. | Land | Improvement |
|---|---|---|---|---|
| 2025 | $2,366 | $143,800 | $19,100 | $124,700 |
| 2024 | $2,328 | $138,000 | $17,900 | $120,100 |
| 2023 | $2,296 | $138,000 | $17,900 | $120,100 |
| 2022 | $2,334 | $115,500 | $17,900 | $97,600 |
| 2021 | $2,336 | $115,500 | $17,900 | $97,600 |
| 2020 | $2,082 | $109,500 | $9,400 | $100,100 |
| 2019 | $2,082 | $109,500 | $9,400 | $100,100 |
| 2018 | $1,766 | $99,600 | $9,400 | $90,200 |
| 2017 | $1,766 | $99,600 | $9,400 | $90,200 |
| 2016 | $1,652 | $89,200 | $7,700 | $81,500 |
| 2015 | $1,652 | $89,200 | $7,700 | $81,500 |
| 2014 | $1,526 | $84,700 | $8,200 | $76,500 |
Source: Public Records
Map
Nearby Homes
Your Personal Tour Guide
Ask me questions while you tour the home.