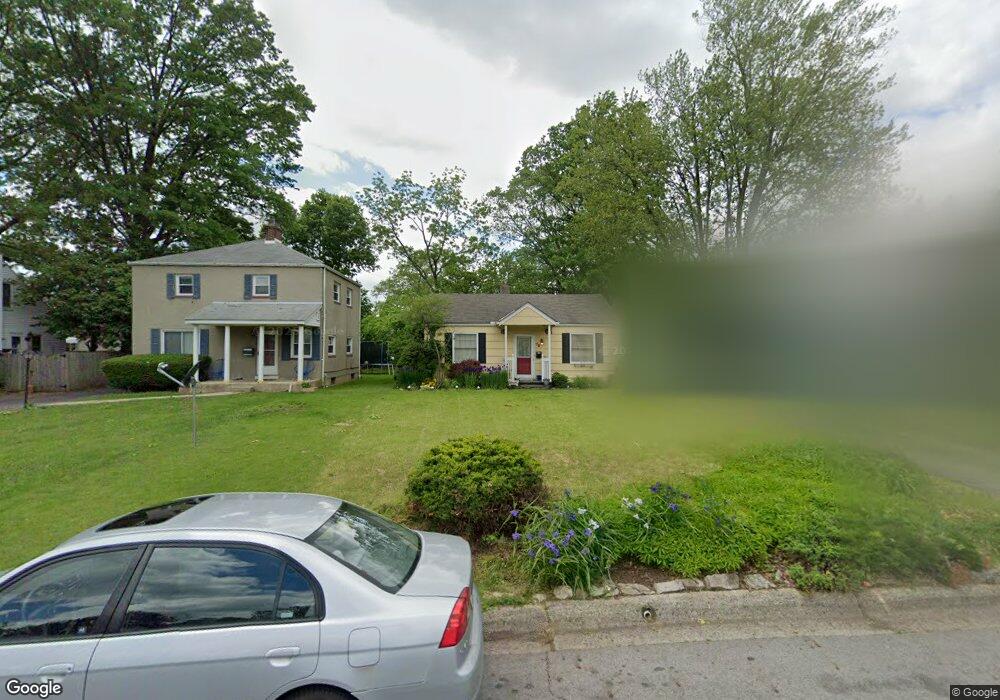
75 N Broadleigh Rd Columbus, OH 43209
Broadleigh NeighborhoodEstimated Value: $189,000 - $267,000
2
Beds
2
Baths
900
Sq Ft
$251/Sq Ft
Est. Value
About This Home
This home is located at 75 N Broadleigh Rd, Columbus, OH 43209 and is currently estimated at $226,319, approximately $251 per square foot. 75 N Broadleigh Rd is a home located in Franklin County with nearby schools including Broadleigh Elementary School, Johnson Park Middle School, and Walnut Ridge High School.
Ownership History
Date
Name
Owned For
Owner Type
Purchase Details
Closed on
Jul 30, 2021
Sold by
Matheny Julie and Mckendry Julie
Bought by
Matheny Laurel
Current Estimated Value
Home Financials for this Owner
Home Financials are based on the most recent Mortgage that was taken out on this home.
Original Mortgage
$130,591
Outstanding Balance
$118,748
Interest Rate
2.9%
Mortgage Type
FHA
Estimated Equity
$107,571
Purchase Details
Closed on
Nov 26, 2002
Sold by
Norby Julia and Norby Julia J
Bought by
Mckendry Julie L
Home Financials for this Owner
Home Financials are based on the most recent Mortgage that was taken out on this home.
Original Mortgage
$93,250
Interest Rate
6.25%
Mortgage Type
FHA
Purchase Details
Closed on
May 9, 1999
Sold by
Norby David B
Bought by
Norby Julia
Purchase Details
Closed on
Oct 13, 1997
Sold by
Dumbauld Julia J and Dumbauld Julia J
Bought by
Norby David B
Purchase Details
Closed on
Mar 18, 1991
Purchase Details
Closed on
Mar 22, 1990
Create a Home Valuation Report for This Property
The Home Valuation Report is an in-depth analysis detailing your home's value as well as a comparison with similar homes in the area
Home Values in the Area
Average Home Value in this Area
Purchase History
| Date | Buyer | Sale Price | Title Company |
|---|---|---|---|
| Matheny Laurel | $133,000 | Northwest Advantage Ttl Agcy | |
| Mckendry Julie L | $94,600 | -- | |
| Norby Julia | -- | -- | |
| Norby David B | -- | -- | |
| -- | $43,500 | -- | |
| -- | -- | -- |
Source: Public Records
Mortgage History
| Date | Status | Borrower | Loan Amount |
|---|---|---|---|
| Open | Matheny Laurel | $130,591 | |
| Previous Owner | Mckendry Julie L | $93,250 |
Source: Public Records
Tax History Compared to Growth
Tax History
| Year | Tax Paid | Tax Assessment Tax Assessment Total Assessment is a certain percentage of the fair market value that is determined by local assessors to be the total taxable value of land and additions on the property. | Land | Improvement |
|---|---|---|---|---|
| 2024 | $3,448 | $76,830 | $30,560 | $46,270 |
| 2023 | $3,404 | $76,825 | $30,555 | $46,270 |
| 2022 | $1,924 | $37,100 | $6,580 | $30,520 |
| 2021 | $1,975 | $37,100 | $6,580 | $30,520 |
| 2020 | $1,978 | $37,100 | $6,580 | $30,520 |
| 2019 | $1,929 | $31,020 | $5,500 | $25,520 |
| 2018 | $1,751 | $31,020 | $5,500 | $25,520 |
| 2017 | $1,855 | $31,020 | $5,500 | $25,520 |
| 2016 | $1,781 | $26,220 | $7,040 | $19,180 |
| 2015 | $1,577 | $26,220 | $7,040 | $19,180 |
| 2014 | $1,581 | $26,220 | $7,040 | $19,180 |
| 2013 | $780 | $26,215 | $7,035 | $19,180 |
Source: Public Records
Map
Nearby Homes
- 50 N Broadleigh Rd
- 47 N Chesterfield Rd
- 50 S Chesterfield Rd
- 205 N Gould Rd
- 123 S Gould Rd
- 142 S Gould Rd
- 2738 E Broad St
- 3235 Maryland Ave
- 2731 E Broad St
- 238 Edgevale Rd
- 263 Edgevale Rd
- 2717 E Broad St
- 2867 Ruhl Ave Unit 869
- 96 N Cassingham Rd
- 49 N Cassingham Rd
- 239 S Kellner Rd
- 2629 E Broad St
- 243 N James Rd
- 253 N James Rd
- 177 N James Rd
- 83 N Broadleigh Rd
- 69 N Broadleigh Rd
- 87 N Broadleigh Rd
- 61 N Broadleigh Rd
- 84 N Gould Rd
- 55 N Broadleigh Rd
- 90 N Gould Rd
- 78 N Gould Rd
- 78 N Gould Rd
- 70 N Gould Rd
- 96 N Gould Rd
- 49 N Broadleigh Rd
- 74 N Broadleigh Rd
- 101 N Broadleigh Rd
- 88 N Broadleigh Rd
- 60 N Gould Rd
- 43 N Broadleigh Rd
- 56 N Broadleigh Rd
- 110 N Gould Rd
- 110 S Gould Rd