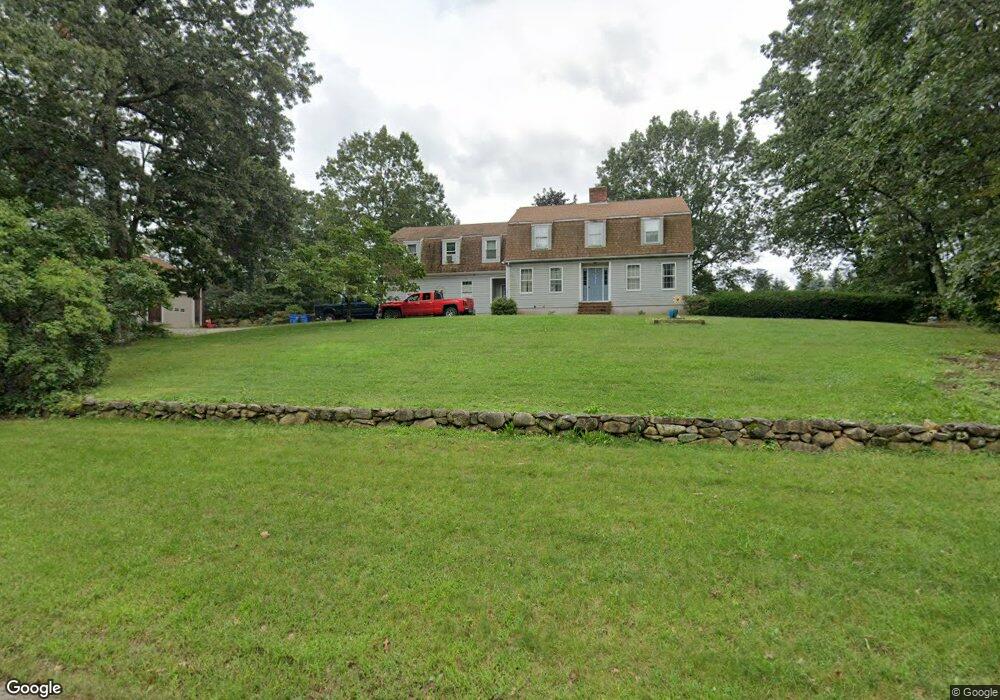
75 Otis St Wrentham, MA 02093
West Wrentham NeighborhoodEstimated Value: $865,293 - $1,061,000
3
Beds
3
Baths
3,250
Sq Ft
$295/Sq Ft
Est. Value
About This Home
This home is located at 75 Otis St, Wrentham, MA 02093 and is currently estimated at $958,323, approximately $294 per square foot. 75 Otis St is a home located in Norfolk County with nearby schools including Delaney Elementary School, Charles E Roderick, and Mercymount Country Day School.
Ownership History
Date
Name
Owned For
Owner Type
Purchase Details
Closed on
Sep 26, 2013
Sold by
Morse Peter W and Maynard Rebecca A
Bought by
Maynard Rebecca A and Morse Peter W
Current Estimated Value
Home Financials for this Owner
Home Financials are based on the most recent Mortgage that was taken out on this home.
Original Mortgage
$210,000
Outstanding Balance
$157,307
Interest Rate
4.42%
Mortgage Type
New Conventional
Estimated Equity
$801,016
Purchase Details
Closed on
Jun 30, 2009
Sold by
Morse Peter W and Maynard Rebecca A
Bought by
Morse Peter W and Maynard Rebecca A
Home Financials for this Owner
Home Financials are based on the most recent Mortgage that was taken out on this home.
Original Mortgage
$150,000
Interest Rate
4.92%
Mortgage Type
Purchase Money Mortgage
Purchase Details
Closed on
May 22, 2009
Sold by
Big Apple 2 Rt
Bought by
Morse Peter W and Morse Benjamin K
Home Financials for this Owner
Home Financials are based on the most recent Mortgage that was taken out on this home.
Original Mortgage
$150,000
Interest Rate
4.92%
Mortgage Type
Purchase Money Mortgage
Create a Home Valuation Report for This Property
The Home Valuation Report is an in-depth analysis detailing your home's value as well as a comparison with similar homes in the area
Home Values in the Area
Average Home Value in this Area
Purchase History
| Date | Buyer | Sale Price | Title Company |
|---|---|---|---|
| Maynard Rebecca A | -- | -- | |
| Morse Peter W | -- | -- | |
| Morse Peter W | -- | -- |
Source: Public Records
Mortgage History
| Date | Status | Borrower | Loan Amount |
|---|---|---|---|
| Open | Maynard Rebecca A | $210,000 | |
| Previous Owner | Morse Peter W | $150,000 |
Source: Public Records
Tax History
| Year | Tax Paid | Tax Assessment Tax Assessment Total Assessment is a certain percentage of the fair market value that is determined by local assessors to be the total taxable value of land and additions on the property. | Land | Improvement |
|---|---|---|---|---|
| 2025 | $8,659 | $747,100 | $285,000 | $462,100 |
| 2024 | $8,407 | $700,600 | $285,000 | $415,600 |
| 2023 | $8,850 | $701,300 | $258,900 | $442,400 |
| 2022 | $8,575 | $627,300 | $251,500 | $375,800 |
| 2021 | $8,512 | $605,000 | $235,000 | $370,000 |
| 2020 | $7,621 | $534,800 | $179,300 | $355,500 |
| 2019 | $7,551 | $534,800 | $179,300 | $355,500 |
| 2018 | $6,859 | $481,700 | $178,900 | $302,800 |
| 2017 | $6,441 | $452,000 | $175,400 | $276,600 |
| 2016 | $6,192 | $433,600 | $170,400 | $263,200 |
| 2015 | $5,926 | $395,600 | $163,800 | $231,800 |
| 2014 | $5,881 | $384,100 | $157,500 | $226,600 |
Source: Public Records
Map
Nearby Homes
- 9 Reagan Ave
- 1620 West St
- 10 Follett Dr
- 60 Grant Ave
- 440 Chestnut St
- 1 Spring St
- 900 Washington St Lot 2
- 0 Fall Ln
- 613 West St
- 11 Amber Dr
- 20 Field Cir
- 925 Washington St
- 18 Bubbling Brook Rd
- 1 Washington St
- 3 Washington St
- 25 Nature View Dr
- 374-378 Union St
- 19 Chestnut St Lot 2
- 19 Chestnut St Lot 3
- 172 Pine Swamp Rd
Your Personal Tour Guide
Ask me questions while you tour the home.